
But indicators are not magic bullets. No single indicator works in every market. That’s why many traders build a full toolkit, instead of leaning on just one indicator.
Technical analysis indicators help traders turn raw data into actionable intelligence.
You’re about to learn 17 of the most popular indicators that you’ll find on your trading platform or charting program. You’ll learn how they work, the pros and cons, and even some of the famous traders that used them, drawing in part on T3 Live’s trading indicators learning center.
We also included chart examples so you can see what each indicator looks like in the real world. But keep in mind that not every platform has every indicator. That’s why you’ll see three different chart formats below. We used Koyfin, Trendspider, and Thinkorswim to ensure we had examples of each indicator.
1. Simple & Exponential Moving Averages (SMA/EMA)
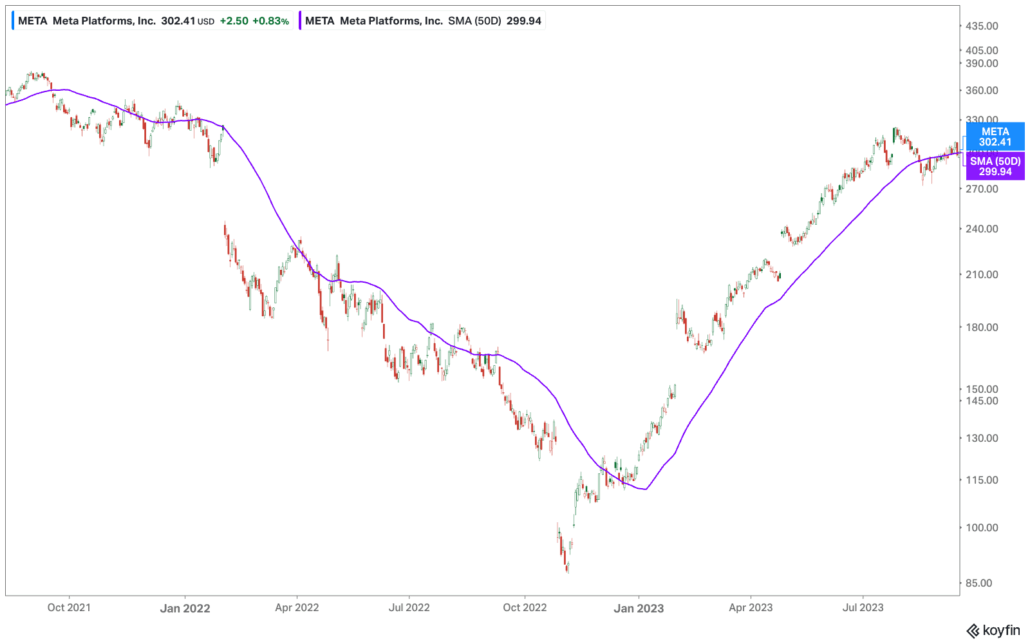
Want to smooth out the noise in short-term market movements? Use moving averages, which average prices over time to show the overall trend. The Simple Moving Average (SMA) treats every price in the period the same. The Exponential Moving Average (EMA) puts more weight on recent prices, so it reacts faster to recent action. Traders use them to identify trend direction, mark support and resistance, and catch crossover signals like the “Golden Cross” and “Death Cross.” Many other indicators are built on top of moving averages, which makes this one of the most basic tools in trading. Many traders pair moving averages with other indicators to find actionable setups.
Pros: Simple to understand. Smooths volatile price action. Works across all timeframes, everything from 1-minute charts to monthly or yearly charts, and asset classes. Forms the basis for many other indicators.
Cons: Lagging by nature since it’s based on past prices. Prone to whipsaws in sideways or choppy markets. Crossover signals can arrive too late to matter.
Famous traders who used it: Richard Dennis and the Turtle Traders built breakout systems around moving averages. Ed Seykota was an early pioneer of computerized trend-following using moving average crossovers. And T3 Live’s Scott Redler and Sami Abusaad make widespread use of moving averages in their own trading.
Here’s a chart of Meta (META) with the 50 day moving average:
Here’s how Sami uses the 20 and 200 day moving averages:
2. Moving Average Convergence Divergence (MACD)
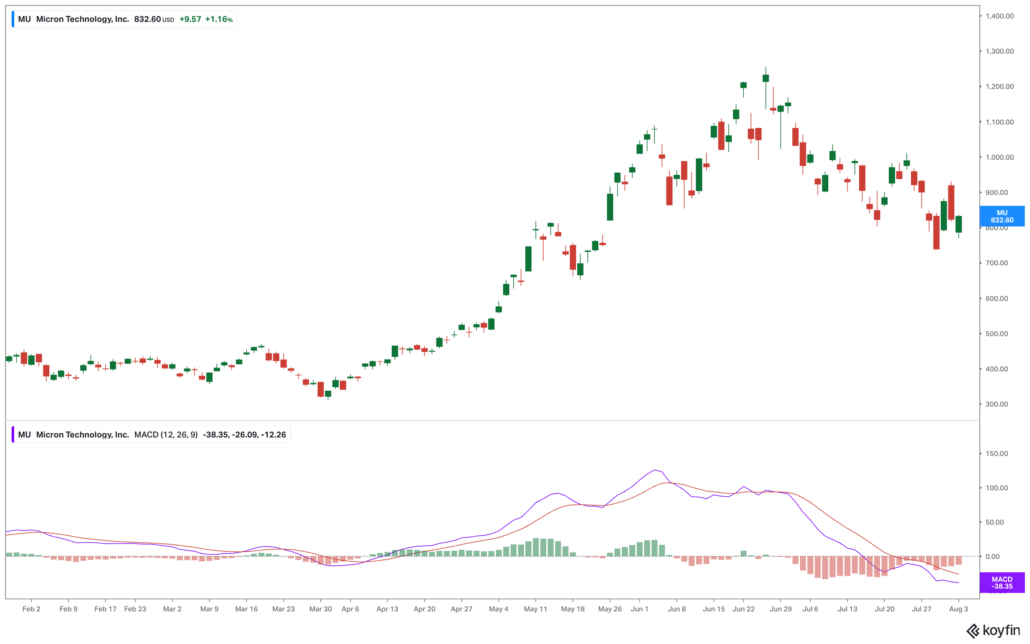
Gerald Appel built the MACD in the late 1970s using just two moving averages. He plotted the gap between a 12-period and 26-period EMA. And then he added a 9-period signal line on top. When the MACD line crosses above the signal line, that means momentum is turning up. A cross below means the opposite is happening. The histogram between the two lines often shifts before the actual crossover happens, giving traders an early clue on what’s coming next. MACD works well because it shows trend and momentum at the same time. Divergence between price and MACD can also warn of a reversal ahead.
Pros: Combines trend-following and momentum in one indicator. Divergence signals can anticipate reversals. Widely available and easy to interpret.
Cons: Still lagging since it’s built from moving averages. Can generate false signals in ranging markets. Less effective on very short timeframes.
Famous traders who used it: Gerald Appel, its creator, used it extensively in his own trading and advisory work. Alexander Elder popularized MACD for retail traders through his “Trading for a Living” methodology.
Here is a chart of Micron (MU) with its MACD:
3. Relative Strength Index (RSI)
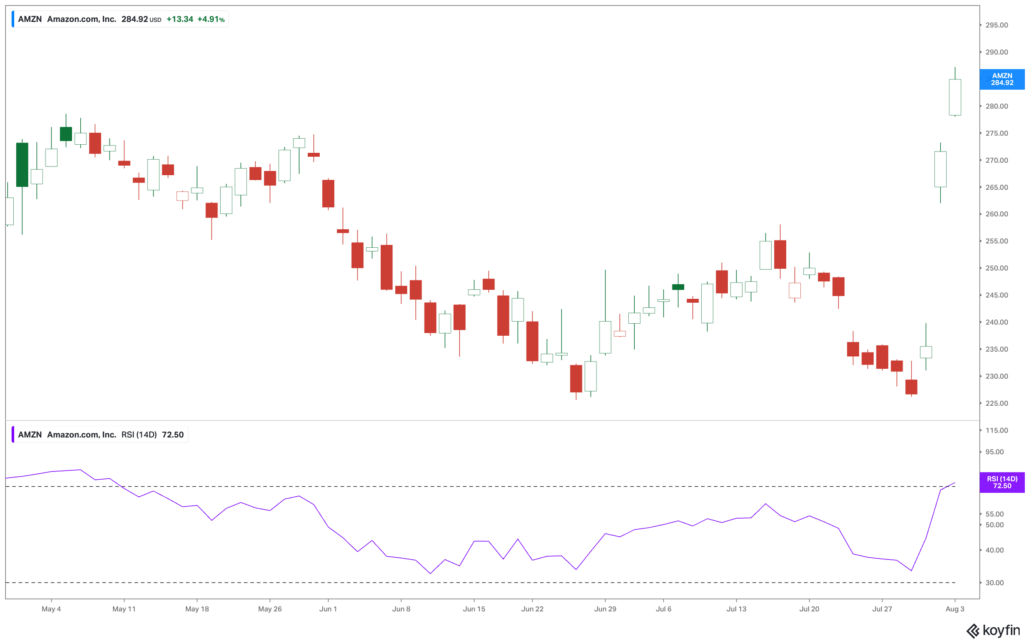
RSI measures how fast and how far price has moved. It’s very popular with swing traders. J. Welles Wilder Jr. introduced it in his classic 1978 book “New Concepts in Technical Trading Systems,” and it’s still everywhere today. The scale runs from 0 to 100. Above 70 is usually read as overbought, and below 30 is oversold. However, many traders tweak these levels for different assets. RSI is best known for spotting divergences. For example, a stock price can make a new high or low, but RSI doesn’t confirm it. That can hint that momentum is fading. But RSI can be tricky with persistent trends. RSI can stay pinned at an extreme for a long time without any reversal showing up, so it tends to work best in choppier, range-bound markets.
Pros: Easy to interpret overbought/oversold levels. Effective for spotting divergences. Works well in ranging markets.
Cons: Can stay overbought or oversold for long stretches during strong trends. Default 70/30 levels need adjustment per asset. Less reliable alone in trending markets.
Famous traders who used it: J. Welles Wilder Jr. developed and traded with it directly. Constance Brown, a prominent technical analyst, refined RSI interpretation for professional trading desks. David Prince of T3 Live’s Inner Circle VTF® has used RSI to trade stocks like Super Micro (SMCI).
Here’s what RSI looks like on a chart of Amazon.com (AMZN):
4. Bollinger Bands
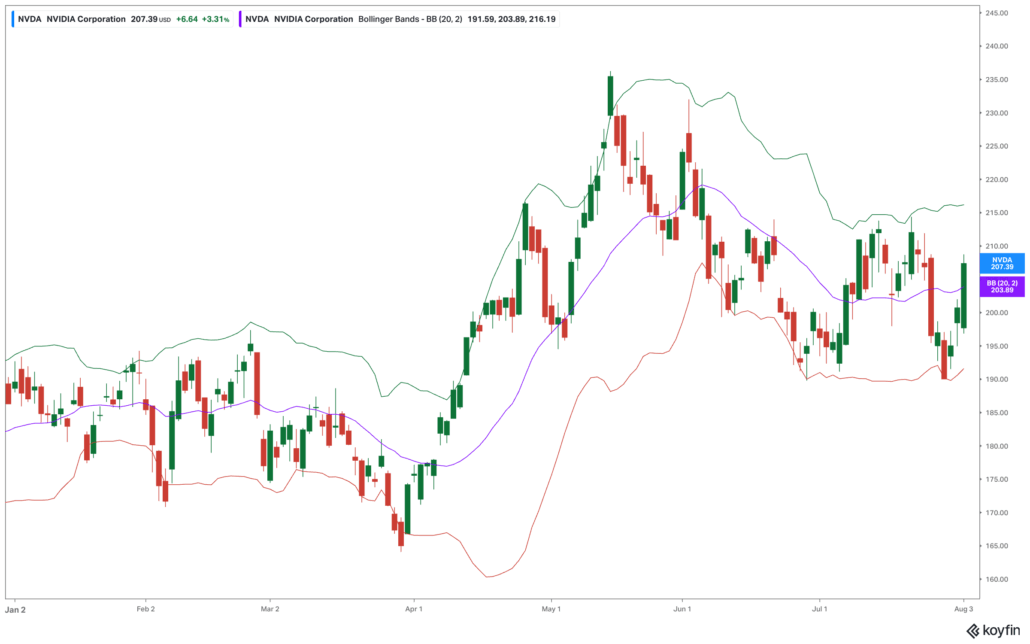
John Bollinger built his namesake tool back in the 1980s. It’s a moving average with two bands around it, set at a standard deviation’s distance. When volatility rises, the bands widen. When vol falls, the bands squeeze in. This gives traders a quick visual look at current conditions. A common mistake is assuming price touching the outer band always means a reversal. In a strong trend, it can just as easily mean the move is speeding up. One pattern worth watching is “the squeeze,” when the bands go unusually tight. That often comes right before a sharp breakout.
Pros: Adapts dynamically to volatility. Useful for both mean-reversion and breakout strategies. Visually intuitive.
Cons: Band touches can be misread as reversal signals during strong trends. Requires pairing with momentum indicators for confirmation. Standard deviation settings need tuning per market.
Famous traders who used it: John Bollinger, obviously, built his entire trading and advisory career around the tool. Many swing traders, including popularizers like Linda Raschke, have incorporated Bollinger Band squeezes into breakout strategies.
Here are Bollinger Bands on an Nvidia (NVDA) chart:
5. Stochastic Oscillator
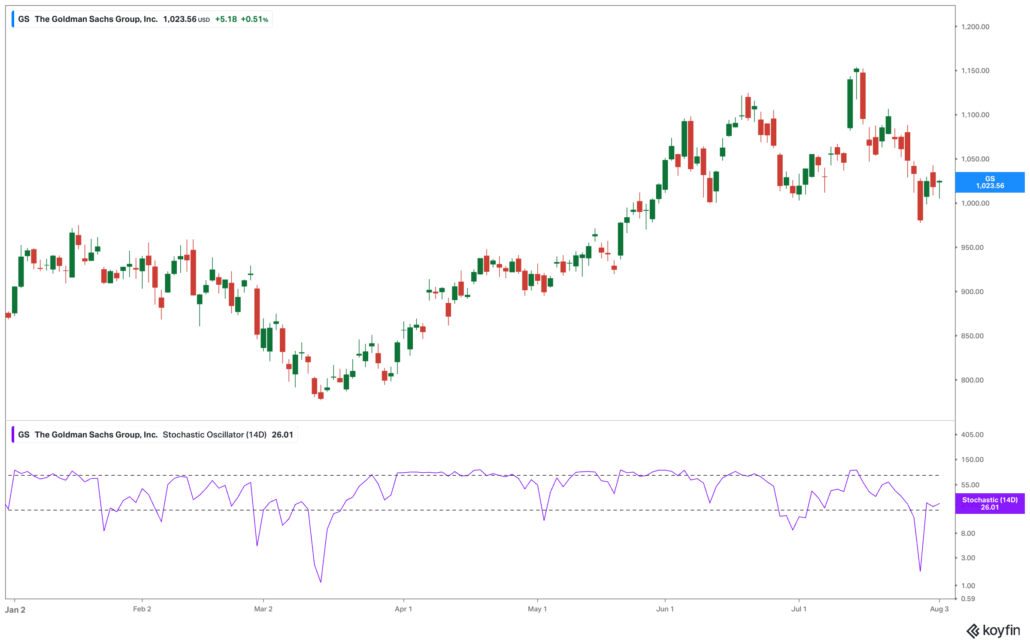
Prices in an uptrend tend to close near their highs. Prices in a downtrend tend to close near their lows. George Lane turned that simple idea into this indicator in the late 1950s. It compares the closing price to the recent high-low range, usually over 14 bars, and produces a reading from 0 to 100. Above 80 is overbought. Below 20 is oversold. The %K and %D lines crossing each other create the classic buy and sell signals. Because it reacts fast, short-term traders like it a lot. But in choppy or strongly trending markets, it can fire off a lot of false signals if used alone.
Pros: Fast-reacting, good for shorter-term trades. Clear overbought/oversold signals. Effective in range-bound markets.
Cons: Can generate frequent false signals in trending markets. Sensitive to short-term noise. Often needs a longer-period filter for confirmation.
Famous traders who used it: George Lane taught and traded the indicator throughout his career at the Chicago Board of Trade. Larry Connors has built multiple short-term trading systems around stochastic readings.
Here is Goldman Sachs (GS) with its Stochastic Oscillator:
6. Fibonacci Retracement
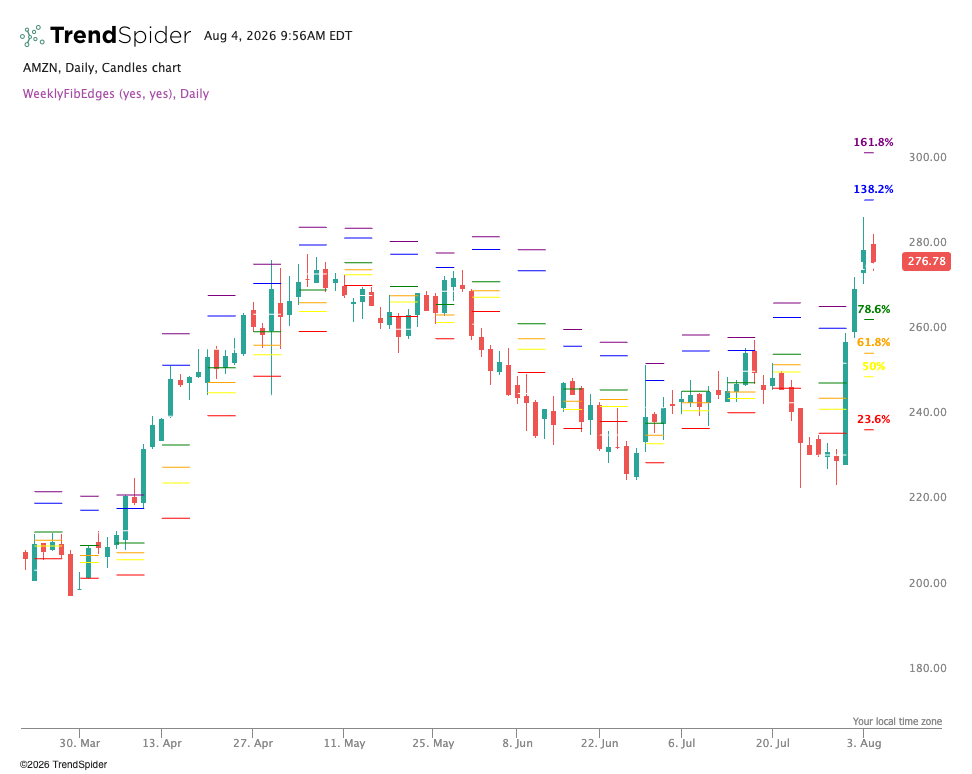
This tool is named after the Italian mathematician Leonardo Bonacci, best known as Fibonacci, the genius behind the number sequence it’s based on. It plots levels between a swing high and low, usually at 23.6%, 38.2%, 50%, 61.8%, and 78.6%. Traders watch these levels closely to guess where a price might stop before the bigger-picture trend continues. They also use them to plan entries, stops, and profit targets. Unlike volume or price tools, there’s no real math proving why these ratios matter, a point T3 Live’s Sami Abusaad has made in explaining why he avoids a precise 50% retracement level. But so many traders watch the same levels that they can become self-fulfilling. Picking the right swing high and low to measure from is a judgment call, which makes the tool fairly subjective on its own.
Pros: Provides objective, repeatable levels for entries and exits. Widely watched, which can reinforce their validity. Works across all timeframes.
Cons: No hard mathematical justification for why markets respect these levels. Subjective in choosing which swing high/low to measure from. Works best combined with other confirmation tools.
Famous traders who used it: Robert Prechter, a leading Elliott Wave theorist, frequently combines Fibonacci retracements with wave counts. Larry Pesavento has written extensively on Fibonacci-based pattern trading.
This is a chart of Amazon (AMZN) with Fibonacci Retracements:
7. On-Balance Volume (OBV)
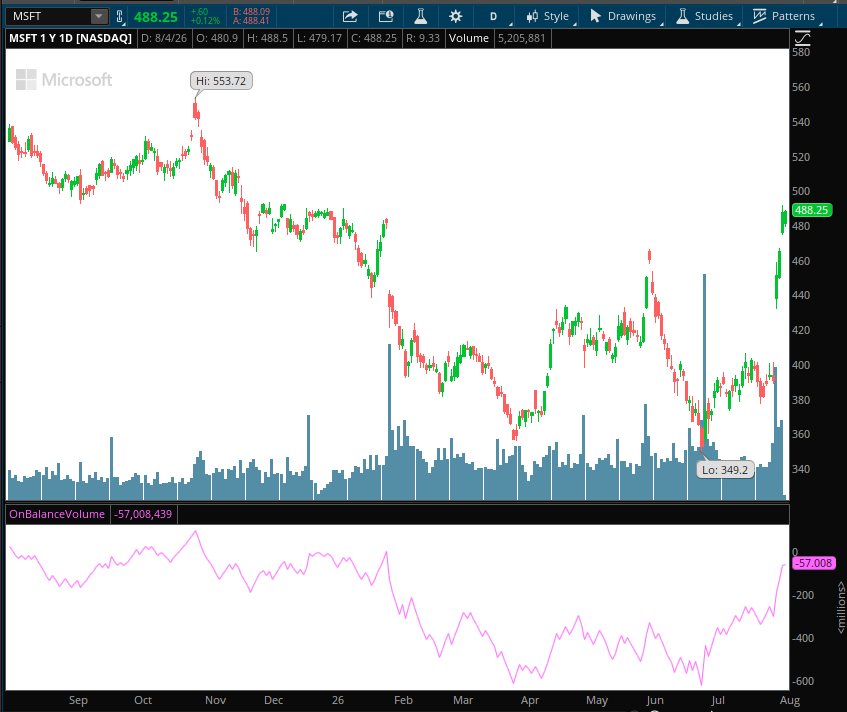
Volume can tell a story that price alone misses. Joseph Granville built OBV in 1963 to capture that story. When price closes higher, that period’s volume gets added to a running total. When price closes lower, it gets subtracted. The result is a line meant to show whether money is flowing in or out of a stock, sometimes before that shows up in the price chart. When OBV moves with price, it confirms the trend. When it moves against price, that’s often an early warning sign. One weakness: OBV only looks at the closing price, not the full range of the day, so it’s rarely used on its own.
Pros: Offers early insight into buying or selling pressure. Simple to calculate and interpret. Effective for confirming trend strength.
Cons: Doesn’t account for intraday price range, only the close. Can produce misleading readings around large one-off volume spikes. Needs price confirmation to be actionable.
Famous traders who used it: Joseph Granville, its creator, was famous for making bold market calls based on volume analysis. Many institutional volume analysts still cite OBV as a foundational tool.
Here is Microsoft (MSFT) with its OBV:
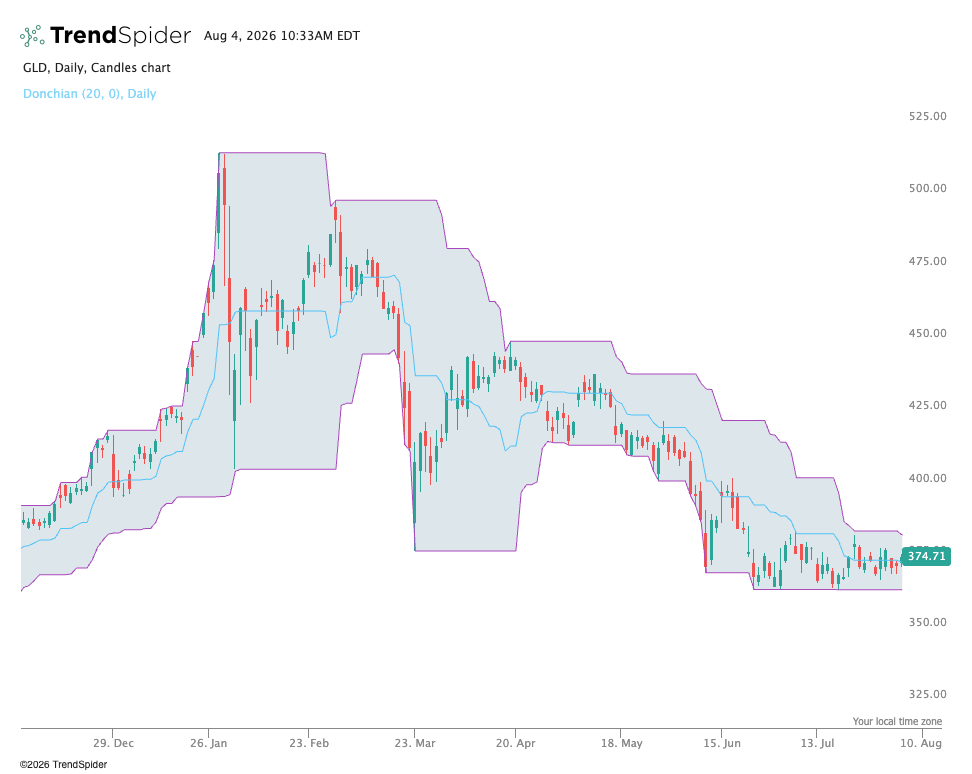
8. Donchian Channels
Richard Donchian, often called the father of trend-following, built this indicator decades before most of the tools on this list existed. It’s about as simple as technical analysis gets: an upper band marking the highest high over a set lookback period, a lower band marking the lowest low, and sometimes a middle line splitting the difference. When price breaks above the upper band, that’s read as a buy signal. A break below the lower band is read as a sell signal. Richard Dennis and William Eckhardt built their famous Turtle Trading system around this exact idea in the 1980s, training a group of novice traders to buy 20-day breakouts and add to winners on 55-day breakouts. That track record is a big part of why Donchian Channels remain a go-to for breakout and trend-following strategies today.
Pros: Extremely simple to calculate and understand. Proven track record in real-world trend-following systems. Works well for defining breakout entries and trailing stops.
Cons: Prone to false breakouts in choppy, sideways markets. Purely price-based, with no volume or momentum context. Lookback period needs tuning for different markets and timeframes.
Famous traders who used it: Richard Donchian, its creator, pioneered systematic trend-following on Wall Street decades before it became mainstream. Richard Dennis and the Turtle Traders built their legendary breakout system directly on Donchian Channel signals.
This the SPDR Gold Trust ETF (GLD) with Donchian Channels:
9. Ichimoku Cloud
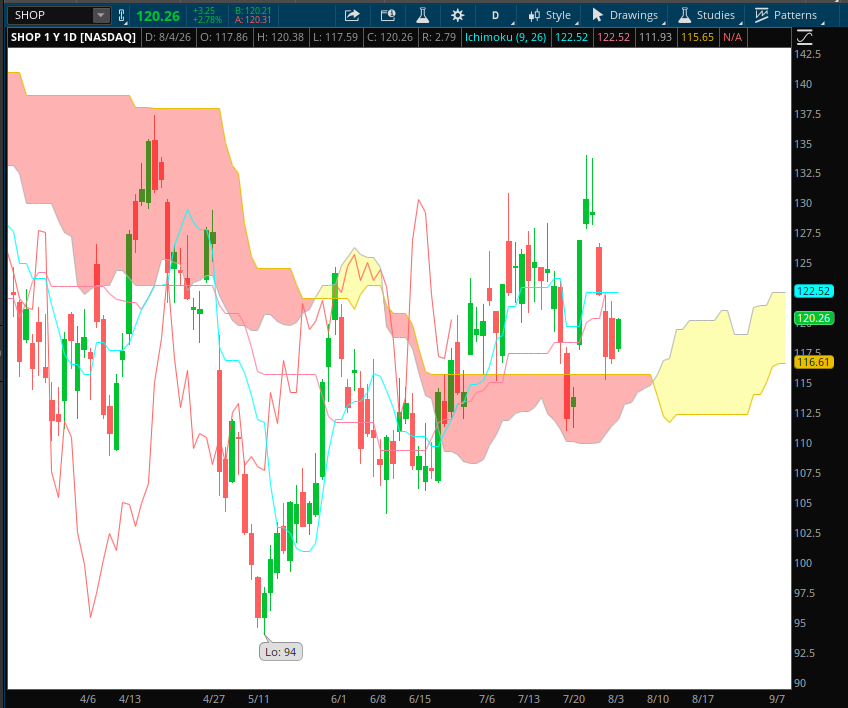
“One glance equilibrium chart.” That’s the literal translation of Ichimoku Kinko Hyo, and it fits. That’s because this system packs trend, momentum, and support and resistance into one simple view. Japanese journalist Goichi Hosoda spent years building the Ichimoku Cloud concept before publishing it in 1969. It uses five lines: the Tenkan-sen, Kijun-sen, two Senkou spans that form the “cloud,” and the Chikou span. Price above the cloud is bullish. Price below it is bearish. The cloud itself acts as a moving support and resistance zone. Forex traders, in Japan and beyond, like it because it replaces several separate indicators with one chart.
Pros: Provides trend, momentum, and support/resistance in one view. Cloud thickness reflects volatility and conviction. Effective across multiple timeframes.
Cons: Visually complex for beginners. Multiple lines can create conflicting signals. Less effective on very short timeframes or illiquid instruments.
Famous traders who used it: Goichi Hosoda spent decades refining the system before publishing it. The indicator remains a staple among Japanese institutional forex desks and has been adopted by many Western forex traders.
Here’s a chart of Shopify (SHOP) with an Ichimoku Cloud laid on top:
10. Parabolic SAR (Stop and Reverse)
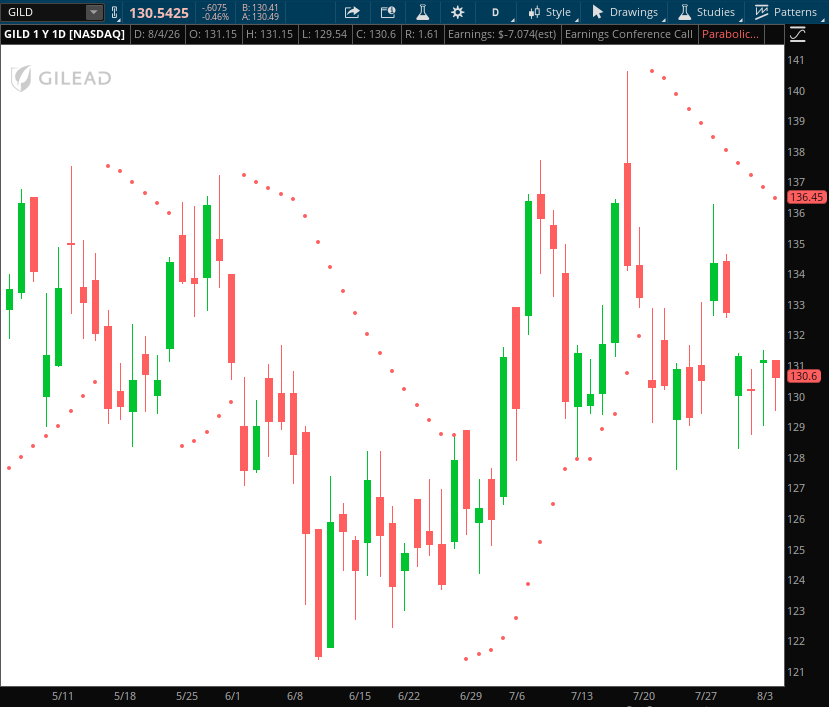
This is yet another tool from J. Welles Wilder Jr. Parabolic SAR uses small dots that hug the price and flip position when a trend turns. Dots below price mean the trend is bullish. Dots above price mean it’s bearish. When the trend runs longer, the dots speed up and move closer to price. That makes Parabolic SAR a popular trailing stop-loss tool in trending markets, and an easy one to read at a glance. It struggles most in sideways markets, where it can flip back and forth and cause a string of small losses. Because of that, it’s rarely used as a standalone entry signal.
Pros: Simple visual trailing-stop mechanism. Clearly signals trend reversals. Works well in strongly trending markets.
Cons: Generates frequent false signals in sideways markets. Can exit trending positions too early during minor pullbacks. Not useful as a standalone entry signal.
Famous traders who used it: J. Welles Wilder Jr. incorporated it into his broader trend-following framework. Many systematic trend-following traders still use Parabolic SAR-style trailing stops to lock in gains.
Here’s an example using Gilead (GILD):
11. Williams %R
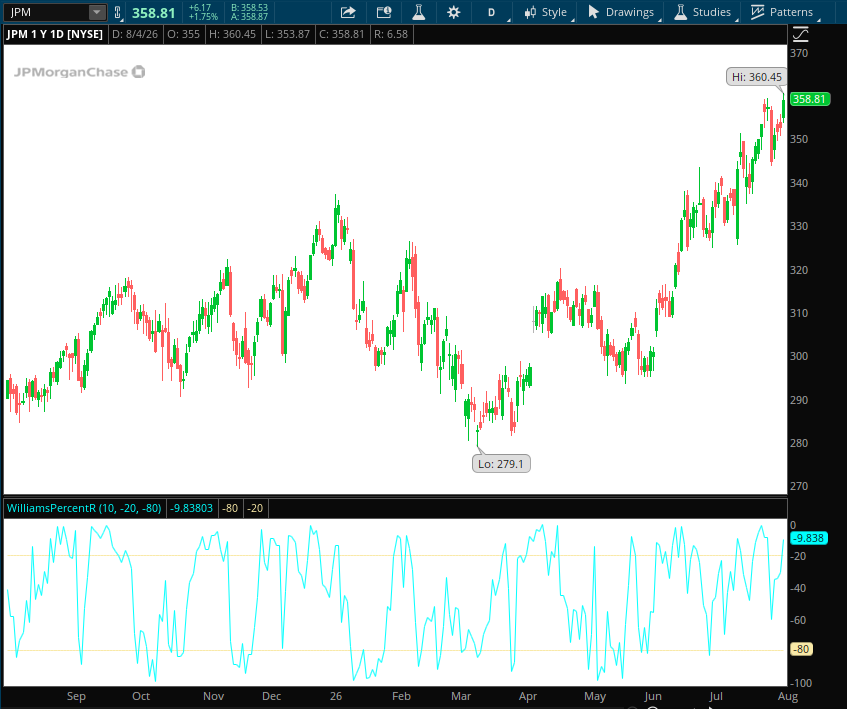
Trading legend Larry Williams built this momentum tool around one simple question: where does the most recent close sit within the last 14 days’ trading range? The scale runs from 0 to -100. Above -20 is considered overbought. Below -80 is oversold. It’s a close cousin of the Stochastic Oscillator, just flipped upside down on the scale. Speed is its number one strength. Williams %R often flags reversals a bit earlier than similar tools, which is why short-term and swing traders like it. That same speed is also its weakness, since it can give you faulty signals early on that shake you out of positions too fast.
Pros: Reacts quickly to price changes. Useful for spotting early reversals. Simple overbought/oversold framework.
Cons: Prone to false signals in trending markets. High sensitivity can create noisy readings. Best used with trend or volume confirmation.
Famous traders who used it: Larry Williams, its creator, famously turned $10,000 into over $1.1 million in the 1987 Robbins World Cup Trading Championship using a system built around his own indicators.
Here’s JP Morgan (JPM) to illustrate the indicator:
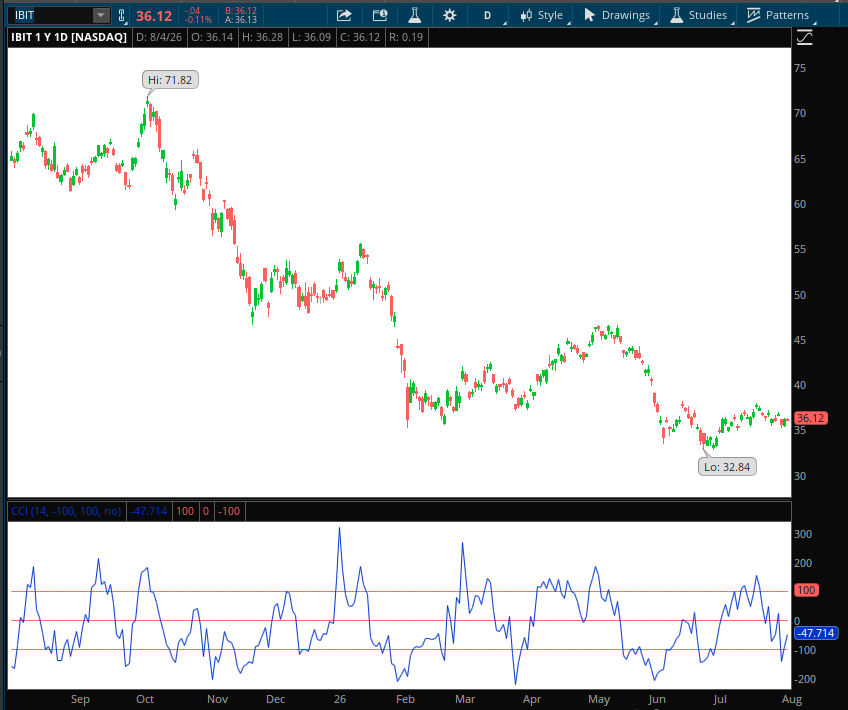
12. Commodity Channel Index (CCI)
Donald Lambert built CCI for commodity traders in 1980. But it’s used in most markets these days. It measures how far price has strayed from its statistical average over a chosen period. Above +100 signals a strong uptrend or overbought condition. Below -100 signals the opposite. Unlike many oscillators, CCI doesn’t have a fixed top or bottom. That lets it capture extreme price moves that a bounded tool might miss. Trend traders use it to catch breaks away from the zero line. Reversal traders use it to spot divergence.
Pros: Unbounded scale captures extreme moves well. Versatile across trending and ranging strategies. Effective for divergence analysis.
Cons: Can remain in extreme territory for extended periods during strong trends. Interpretation of thresholds varies by asset. Less intuitive for beginners than bounded oscillators.
Famous traders who used it: Donald Lambert designed it originally for commodity futures traders. CCI remains popular among systematic commodity trading advisors for both trend and mean-reversion strategies.
Here’s how it looks with the iShares Bitcoin ETF (IBIT):
13. Average True Range (ATR)
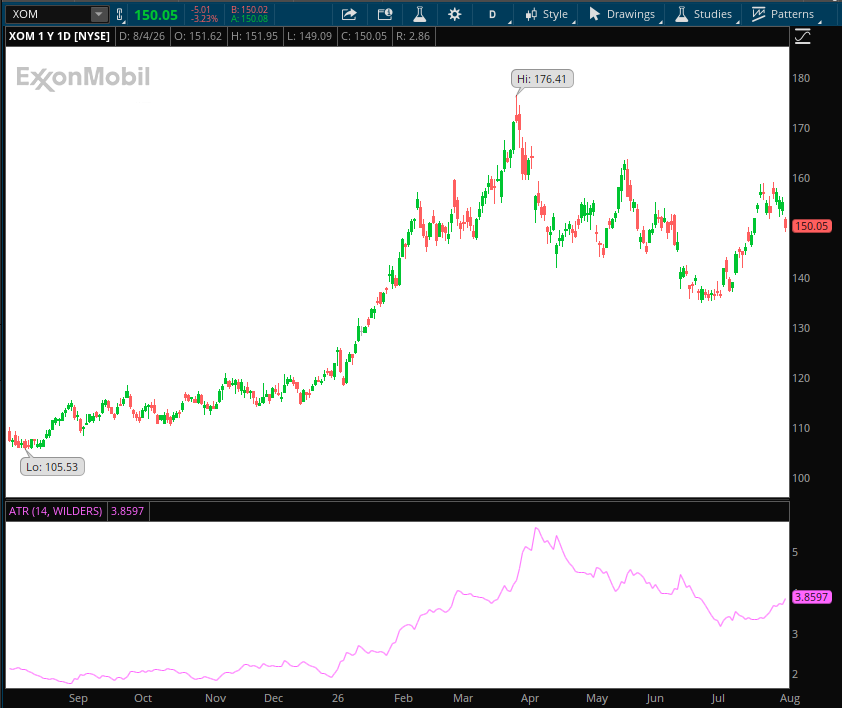
How much is a market actually moving, regardless of direction? That’s what ATR measures. J. Welles Wilder Jr. built it to average the true range between the high, low, and prior close, usually over a period of 14 days. It says nothing about direction. It just expands when things get volatile and shrinks when the market calms down. But where it really helps is risk management. A stop-loss set as a multiple of ATR adjusts itself to current conditions. That can be a nice alternative to a fixed dollar or percentage amount that’s too tight in wild markets, and too loose in slow ones.
Pros: Excellent for adaptive stop-loss and position-sizing decisions. Reflects real volatility rather than assumptions. Applicable across all asset classes.
Cons: Provides no directional signal on its own. A lagging measure based on historical ranges. Requires pairing with a trend or entry signal to be actionable.
Famous traders who used it: J. Welles Wilder Jr. built it into his broader volatility-based trading framework, introducing it alongside RSI and Parabolic SAR in his original 1978 book. Many professional risk managers and CTAs use ATR-based position sizing as a core part of their risk models.
Here’s an ExxonMobil (XOM) daily chart with ATR:
14. Volume Weighted Average Price (VWAP)
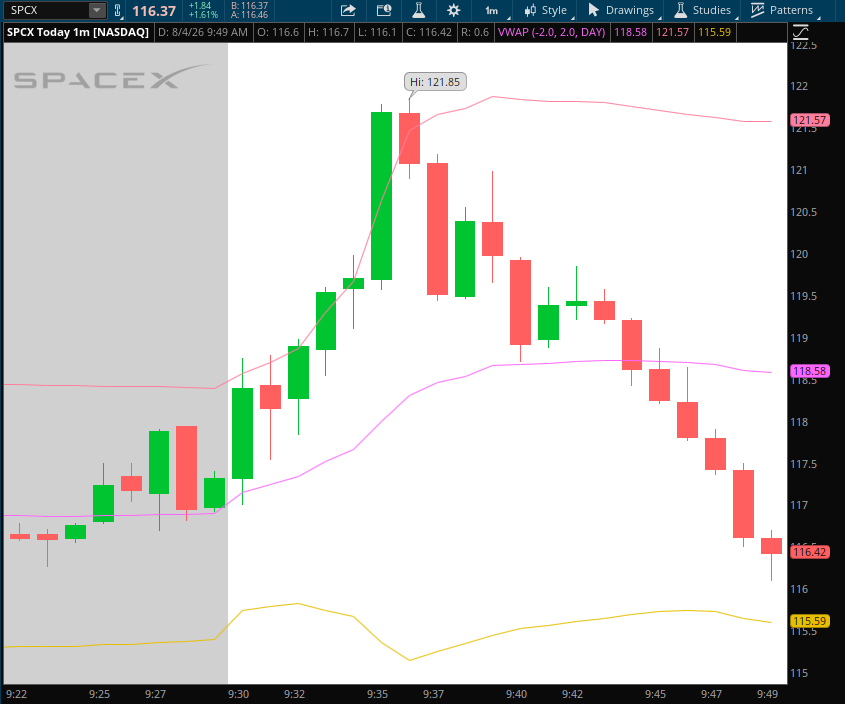
VWAP has become a very popular indicator in recent years. Buying below VWAP, or selling above it, is what many trading desks call a good fill. VWAP resets every session. It tracks the average price a stock has traded at all day, weighted by how much volume traded at each price. That gives traders a live benchmark for the day’s “fair value.” Intraday traders also use VWAP as a support and resistance line, watching how price reacts around it. Its main weakness is the daily reset. Since it starts fresh each session, it can’t tell you anything about the bigger, multi-day picture.
Pros: Widely used institutional benchmark for execution quality. Effective intraday support/resistance reference. Reflects real, volume-weighted trading activity.
Cons: Resets daily, limiting its use for multi-day analysis. Less useful in low-volume or illiquid securities. Can lag fast intraday moves.
Famous traders who used it: VWAP is a standard execution benchmark across institutional trading desks. T3 Live contributors like Scott Redler and JR Romero both make regular use of VWAP in their own active trading, and many other prop and day traders feature it prominently in intraday strategies.
This is a 1-minute chart of SpaceX (SPCX) with VWAP:
15. Pivot Points
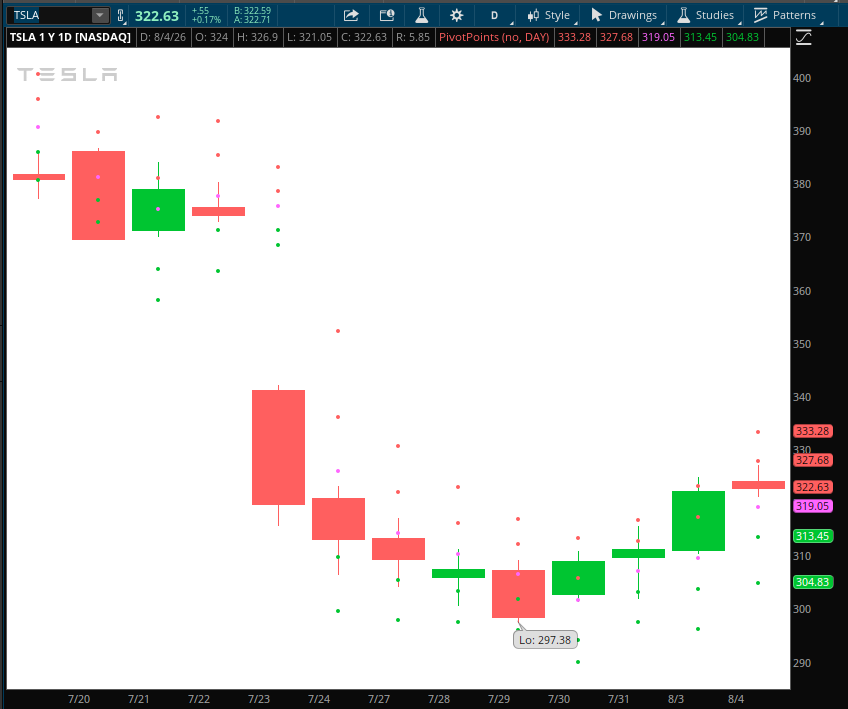
Floor traders calculated pivot points by hand long before charting software existed. They’d take the prior session’s high, low, and close, and use them to work out a central pivot, plus three levels of support (S1, S2, S3) and resistance (R1, R2, R3) for the day ahead. Since nearly every trader calculates these the same way, the levels are often thought to become spots where price genuinely reacts. Day traders and futures traders still use pivot points for setting intraday targets and stops without needing to make subjective chart calls. The biggest downside is that it only looks backward. It can’t account for fresh news or a sudden shift in the market.
Pros: Objective, formula-based levels with no subjectivity. Widely watched, reinforcing their reliability. Easy to calculate for any timeframe.
Cons: Purely reactive to prior price action, not predictive of new information. Less effective during high-impact news events. Can produce too many levels to act on cleanly.
Famous traders who used it: Pivot points originated on commodity and futures trading floors and remain a staple among floor-trained futures traders and day trading educators.
Here’s a daily chart of Tesla (TSLA) and its Pivot Points:
16. Chaikin Money Flow (CMF)
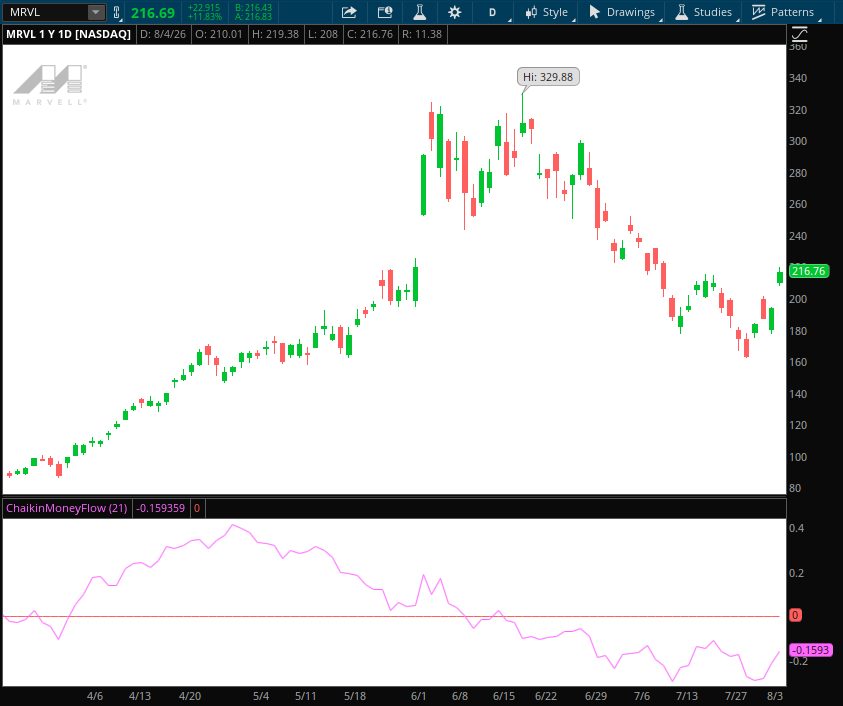
Is a stock being accumulated? Or is it being systematically sold off? That’s the question Marc Chaikin built CMF to answer. This indicator combines price and volume over a typical 20- or 21-day window. Each day’s close gets weighted by where it fell in that day’s high-low range, then weighted again by volume, and summed into a value between -1 and +1. A positive reading points to buying pressure. A negative one points to selling pressure. Traders watch both the sign and the trend of the line to confirm moves or catch early divergence from price. It tends to get noisy on thinly traded stocks or shorter time windows.
Pros: Combines price and volume for a fuller picture of buying/selling pressure. Useful for confirming trend strength. Effective for divergence analysis.
Cons: Can be noisy over shorter lookback periods. Less reliable in low-volume securities. Requires context from price action to interpret correctly.
Famous traders who used it: Marc Chaikin, its creator, built an entire analytics firm (Chaikin Analytics) around money flow and volume-based indicators. The tool remains popular among institutional analysts assessing accumulation/distribution patterns.
Here is Marvell (MRVL) with the CMF indicator:
17. Elliott Wave Theory
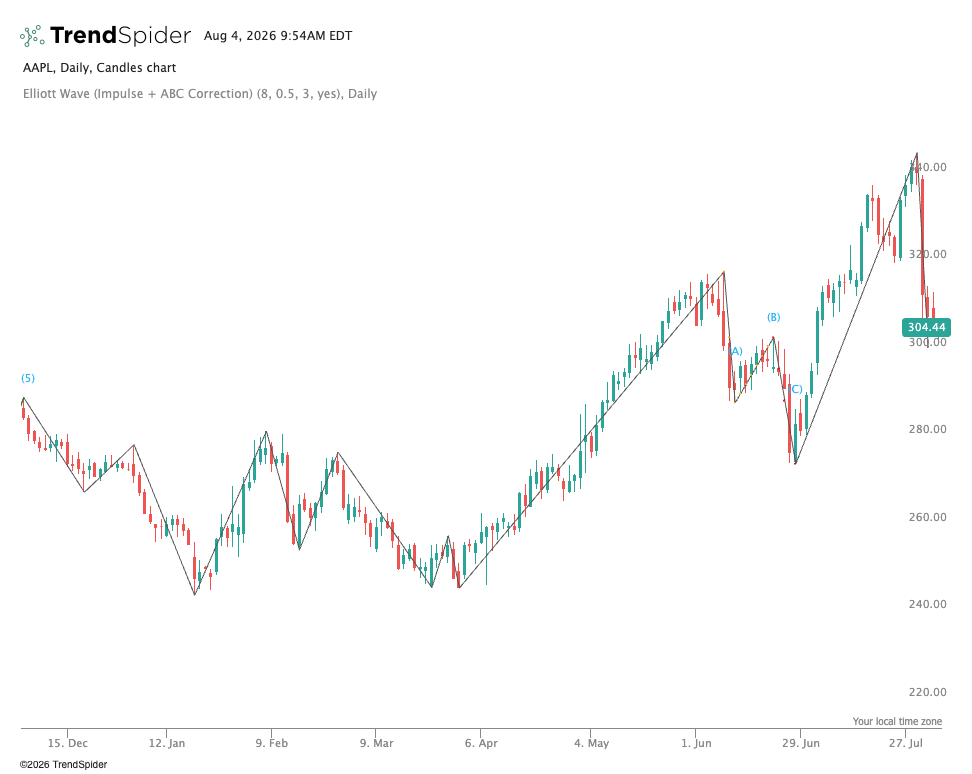
Markets move in waves, according to Ralph Nelson Elliott. According to Elliott Wave Theory, there are five waves with the main trend, and then three waves against it. He built the theory in the 1930s, and traders have refined it ever since. It’s often paired with Fibonacci ratios to guess where price might turn and how far it might go. But it’s very open to personal interpretation. Two analysts can look at the same chart and count the waves completely differently. Even so, its biggest fans point to moments like the 1987 crash as proof that it can catch major turns other tools miss.
Pros: Can identify major trend turns well in advance. Incorporates market psychology directly. Pairs naturally with Fibonacci analysis.
Cons: Highly subjective wave counts, with different analysts often reaching different conclusions. Steep learning curve. Difficult to backtest systematically.
Famous traders who used it: Ralph Nelson Elliott developed the theory after studying decades of market data. Robert Prechter popularized it through the Elliott Wave Theorist newsletter. Paul Tudor Jones has cited Elliott Wave analysis among the tools that helped him anticipate the 1987 market crash.
Here’s Apple (AAPL) with Elliott Wave lines on the chart:
Final Thoughts
No single indicator on this list is a full trading system on its own. Traders will often layer two or three tools together: one for trend, one for momentum, and one for volatility or volume. Test each indicator on your own market and timeframe. Know whether it leads or lags. And always pair it with solid risk management. That matters more than the indicator itself.
Want to take the next step with indicators for FREE?
Check out this eBook from Scott Redler. 100% FREE.