For Every Stock There is a Season
In the deep south, we’ve fully entered into summer time. That means we can depend on hot, humid weather until about the middle of October. While I can’t pinpoint the exact date the miserable humidity will subside, I do trust my timing prediction of the approximate change of the season. That’s because the seasons are dependably cyclical. They announce their coming and going with tell tale signs. The patterns of the seasons are comforting in their predictability.
I like to frame my thinking in the observation of repeatable patterns as a means to navigating life because a predictable future is easier to plan for than a completely haphazard one. It’s a sometimes serendipitous quirk and a sometimes rueful lament that life doesn’t always conform to my mental models of pattern recognition. Markets are a microcosm of life in this regard.
A mental model of how markets should work is an essential, if not always useful, toolkit in the business of speculation. The notion that the buying and selling of different groups of stocks could be timed based on cyclical patterns was compelling to me when I started trying to figure out how the market works over 18 years ago. The pattern I use as a mental model to try and determine what “season” the market is in is this graphic depiction of the business cycle:
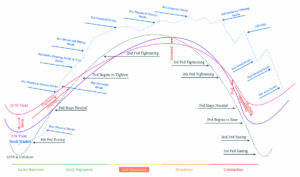
This graph is more of a guideline rather than an instruction manual. The nature of markets is such that perfect conformity to a standard is not high on a list of observable traits.
I’ve noticed over the years, that while perfect conformity to this pattern is not realistic, there are observable cycles that do approximately represent the pattern this cycle predicts.
The QE era from 2012 to 2022 was a horrible period for trying to use this graph as a guide. But ever since the first rate hike cycle got under way in April 2022, this graph has proven to be a useful guide to me once again. The biggest trade of my life was gold miners from 2023 to autumn 2025, and while my P&L was compelling me to lock in gains on the way up, this cycle graph is what steeled my resolve that letting go of the stocks that made my gains was the only sensible course of action. T
he Fed began easing, and I knew from the last time this cycle worked in 2007 that the metals and mining stocks, including the gold mining stocks, should be sold. That decision to lock in profit was a monumental one for me.
Now, once again, I feel comfortable using this cycle graph as a guide to determine how to deploy my capital next. My view is that we are in the contraction phase of the business cycle, and my biggest position is by far cash.
Several indicators don’t line up exactly with this cycle graph, so I’m not clinging to my view, in fact, I’ve got one foot out of the door on this view already. I’m already building mental models of what would prove my view to be incorrect (one development that would begin invalidate my view is if crude oil holds this 200 day moving average, and makes a run for the highs later this year). But for the moment, I’m planning on using this cycle graph as a guide for what the buy next.
The contraction phase of the business cycle should make earnings less predictable, which should make any reliable growth in earnings worth more to institutional investors whose waves of buying leave footprints on the tape. Traditionally, they should be willing to shift capital into drug and grocery store stocks due to the predictable earnings in a weak economy.
The consumer packaged goods stocks are all in horrific downtrends, so I’ll need to see some reversal there before I think about building a big position. I’ve never seen $GIS yield this much (5.5% div yield) or trade this cheap (11 PE), but I’ve never seen it have sustained volume declines either. $GIS reports July 1 so I’ll see what they say about volumes and pricing there. This could be the bottom if they are able to stop the declines and get back to growth, but I have no insight there so I’m just watching for now. The consumer packaged goods space is in too much trouble to confidently take a large position.
The drug stocks however, are beginning to show the tell tale signs of a change in season. The $IBB is shaping up nicely. $ABBV jumped the gun and bought $APGE this week. $APGE had a picture perfect set up that let you know institutions were buying up all the supply at lower prices, but the SPX with an 8 day moving average underneath the 21 kept me out of breakout trades. $APGE didn’t even give a proper breakout signal before it got taken off the board, but this serves as validation that drug stocks are in play, underpriced, forming constructive price structures, and in the correct part of the business cycle.
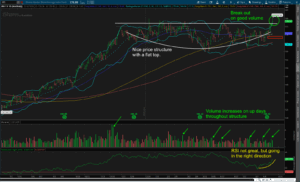
$AUPH is another one with a text book price structure setup for a breakout. It already broke out above it’s flat top at $16.50 on a gap up. It’s a low risk buy under $17, but I’ve never had good results chasing. There will always be other opportunities. With the SPX and NDX flopping around their 8 and 21 day moving average stack, I think there’s a possibility patience will be rewarded and offer a brief moment to get in something before a trend move higher starts and doesn’t let you in without chasing.
I’m still looking towards the August time frame as a period when the market has to deal with a tapped out consumer, services prices that are just too high, and the ramifications of the private credit and life insurance debacle, so a summer rally into Autumn, then a big market reaction is a scenario I’m planning for.
Commodities are dropping (led by gold which is signaling a big deflationary event – likely tied to private credit), prices at the grocery store are coming down, gasoline is coming down, but everything housing and services related like insurance are still way too high. AI is coming for those business models. We’re going to get the cost of living down one way or another this year I think.
Health insurance is by far the largest expense for the American family. It’s more expensive than a mortgage, home insurance, and property taxes combined. Many tasks that people used to need a doctor for can be done with AI. Money is going to shift around massively in the health care stocks as AI works itself into our healthcare payment system. There are going to be winners and losers when that occurs. The stock chart price structures that are forming now should key us in as to who the likely winners will be.
The price structures are obvious, but the fundamental foundations that support the price structures are a little more time consuming to mentally construct. I’ve got a list of stocks that are forming nice price structures, and I’m doing the work to build a picture of which ones might be the best stories. I’m building a template off $APGE and $AUPH, as both had very positive developments before the breakouts.
$APGE had a drug that was ready to go to Phase 3 and showed good results for more uses beyond the initial dermatological treatments.
$AUPH is seeing real cash generation, and used that cash to grow its pipeline so it’s less of a single drug speculative biotech now. It’s still going to be volatile as the gap up was due to a hedge fund taking a 10% stake, which carries less weight than a true fundamental breakout.
$BIIB is cheap on historical metrics, but it doesn’t appear to have an obvious positive catalyst.
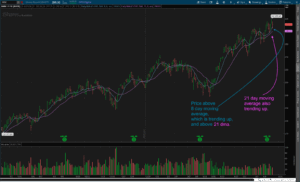
For the time being, $IBB seems like the safest bet to start building a position, as it’s breaking out above $175, but we need to see the SPX and NDX shape up more like the $IWM: with a nice trend above the 8 and 21 day moving averages.
Here is the $IBB. With a stop under $170, it can be bought up to $183 and still risk an acceptable 7%:
And here’s the $IWM, and what we’d like to see start to develop in the SPX and NDX:
Just like the changing of the seasons, the market is always in motion, always progressing towards the next phase.
Down here in the South, it’s easy to think that the heat of summer will never end, but before we know it, summer will be over.
It’s easy to think this up cycle in the market will never end, but like all cycles, the phase shift eventually comes, and I plan on being in position for when it comes.
By: Patrick G. Full-time independent trader in Atlanta, GA.
Patrick G is a full-time trader. Worked for a decade in a money management firm as a trader for high net-worth individuals.
He invested his and his family’s net worth into gold and mining stocks before the Covid money printing. Gold and commodity runs of the past 3 years allowed Patrick to trade full-time due to his gains.
Past performance does not guarantee future results. Trading involves significant risk of loss, and individual results vary. Positions mentioned are the author’s own, disclosed for transparency — not individual investment advice.

ATTN: Serious Options Traders
There Is Just ONE Epic Trade Every Week