
Moving Averages Explained: SMA vs. EMA, How to Calculate Them, and Which One to Use (20, 50 & 200-Day)
Introduction to Moving Averages
If there’s one technical indicator every trader encounters, from the freshest newbie to the biggest hedge fund honcho, it’s the moving average.
Our pros like Sami Abusaad use moving averages every single day.
You’ll see them on every chart, every platform, and in nearly every conversation about trends, support, and resistance. But “moving average” isn’t one single thing.
There are different types (simple vs. exponential), different timeframes (20-day, 50-day, 200-day, and beyond), and countless ways traders use them, depending on their goals and preferences.
- What a moving average actually is, and how it’s calculated
- The difference between a Simple Moving Average (SMA) and an Exponential Moving Average (EMA)
- How the 20-day, 50-day, and 200-day moving averages compare, and when to use each one
- What a Golden Cross and Death Cross (yes, Death Cross is a real thing)
- The core strategies traders use moving averages for
- How to decide which moving average fits your trading style
In this super in-depth guide, we’ll cover:
If you want a deep dive on a more specific timeframe, we’ve got dedicated guides on the 20-day moving average, 50-day moving average, and 200-day moving average. This article is the map that ties them all together.
What Is a Moving Average?
A moving average is a line on a chart that represents the average closing price of a stock, index, or ETF over a specific number of past periods.
Here’s an example of SanDisk (SNDK) with its 20-day moving average:
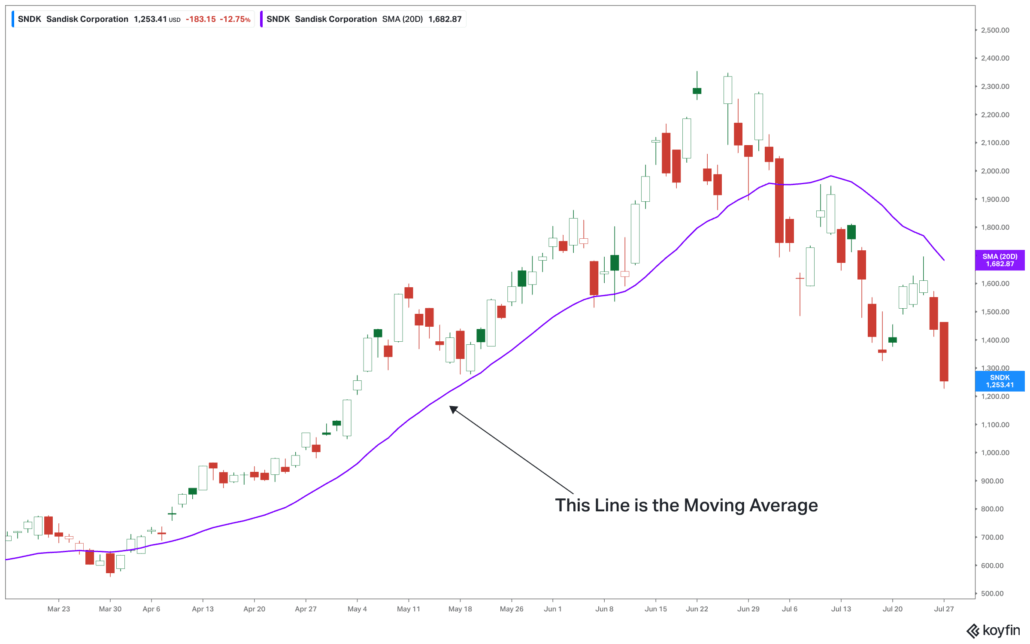
It’s called “moving” because it updates every day. When a trading day closes, the oldest price in the calculation drops off and the newest one is added. So it changes a little bit every day. And the more the underlying stock changes, the more the moving average moves.
Since SanDisk was rising pretty much nonstop, its moving average was rising steadily. (until it wasn’t, of course)
Traders use moving averages to smooth out the day-to-day noise in price action, making it easier to see the underlying trend.
While moving averages are most commonly applied to daily charts, they work on any timeframe.
You’ll find short-term scalpers using moving averages on 1-minute charts, and swing traders tracking monthly trends.
For the purposes of this guide, we’ll focus on daily moving averages, since that’s what most traders use.
But you can adapt these lessons to any time frame.
Simple Moving Average (SMA) vs. Exponential Moving Average (EMA)
There are two types of moving averages you’ll encounter constantly: the Simple Moving Average (SMA) and the Exponential Moving Average (EMA).
They’re built differently, and that difference matters. You don’t need to understand the exact math. Just the basics of each.
What Is a Simple Moving Average?
A Simple Moving Average is exactly what it sounds like — a straight average of closing prices over a set number of periods, with every price weighted equally.
The formula:
SMA = (P1 + P2 + P3 + ... + Pn) / n
Where P is the closing price for each period, and n is the number of periods.
A worked example. Let’s calculate a 5-day SMA using these closing prices:
| Day | Closing Price |
|---|---|
| 1 | $100 |
| 2 | $102 |
| 3 | $101 |
| 4 | $105 |
| 5 | $107 |
Add them up: $100 + $102 + $101 + $105 + $107 = $515
Divide by 5: $515 / 5 = $103
That’s it. The 5-day SMA on Day 5 is $103.
Tomorrow, Day 1’s price ($100) drops off, a new closing price gets added, and you recalculate.
That’s what makes this a “moving” average:
| Day | Closing Price |
|---|---|
| 2 | $102 |
| 3 | $101 |
| 4 | $105 |
| 5 | $107 |
| 6 | $110 |
In the table above, you can see that the Day 1 price of $100 dropped off, and Day 6’s price of 110 was added.
Add them up: $102 + $101 + $105 + $107 + $110 = $525
Divide by 5, and you get your new moving average of $105.
That’s up from $103 the previous day.
A 20-day, 50-day, or 200-day SMA works exactly the same way, just with more prices in the average.
What Is an Exponential Moving Average?
An Exponential Moving Average also averages closing prices, but it applies more weight to recent prices and less weight to older ones. The result is a line that reacts faster to new price action than an SMA does.
The formula:
EMA = (Close - Previous EMA) x Multiplier + Previous EMA
Where the multiplier is calculated as:
Multiplier = 2 / (n + 1)
For a 20-day EMA, the multiplier would be 2 / (20 + 1) = 0.0952, or about 9.5%.
In plain English: each day, the EMA takes the previous EMA value, adjusts it toward the current closing price, and gives that adjustment more weight than an SMA would. The starting point is typically calculated using an SMA over the first n periods, then the formula takes over from there.
You don’t need to calculate this by hand while trading because every charting platform does it automatically. But understanding the mechanics helps explain why an EMA line is closer to the current stock price, especially during sharp moves.
Look at this chart of Tesla (NVDA) with the 20-day simple moving average (SMA), and 20-day exponential moving averages (EMA).
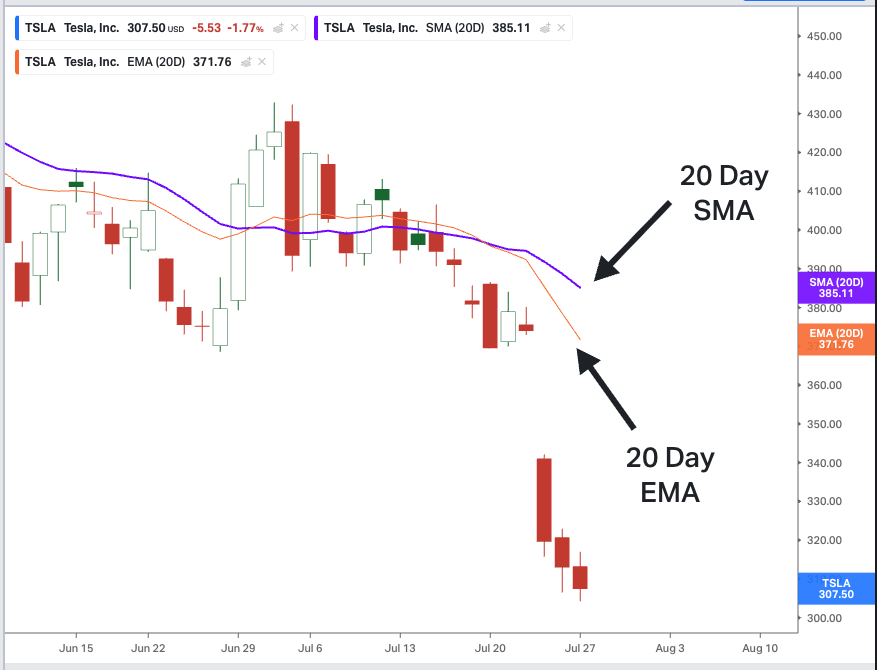
As you can see, the 20 day EMA is closer to the actual stock price.
SMA vs. EMA: Quick Comparison
| Simple Moving Average (SMA) | Exponential Moving Average (EMA) | |
|---|---|---|
| Calculation | Equal weight to all prices | More weight on recent prices |
| Responsiveness | Slower to react | Faster to react |
| Best for | Identifying broader trend, less noise | Catching trend changes earlier |
| Trade-off | Can lag significant moves | More prone to false signals in choppy markets |
Neither is objectively “better” — it depends on whether you want a smoother, more stable read (SMA) or a quicker, more reactive one (EMA).
The Most Popular Moving Averages: 20-Day vs. 50-Day vs. 200-Day
While you can calculate a moving average over any number of days, three timeframes dominate: the 20-day, 50-day, and 200-day. Each serves a different purpose depending on your trading horizon.
| Timeframe | Trend Captured | Typical User | Responsiveness | Learn More |
|---|---|---|---|---|
| 20-Day | Short-term | Day traders, active swing traders | Fast — reacts quickly to new price action | Full 20-Day Guide |
| 50-Day | Intermediate-term | Swing traders | Balanced — smooths noise while staying responsive | Full 50-Day Guide |
| 200-Day | Long-term | Investors, position traders | Slow — filters out short-term noise entirely | Full 200-Day Guide |
Here is a chart showing all 3 of the most popular moving averages on a single chart of the semiconductor stock Micron (MU):
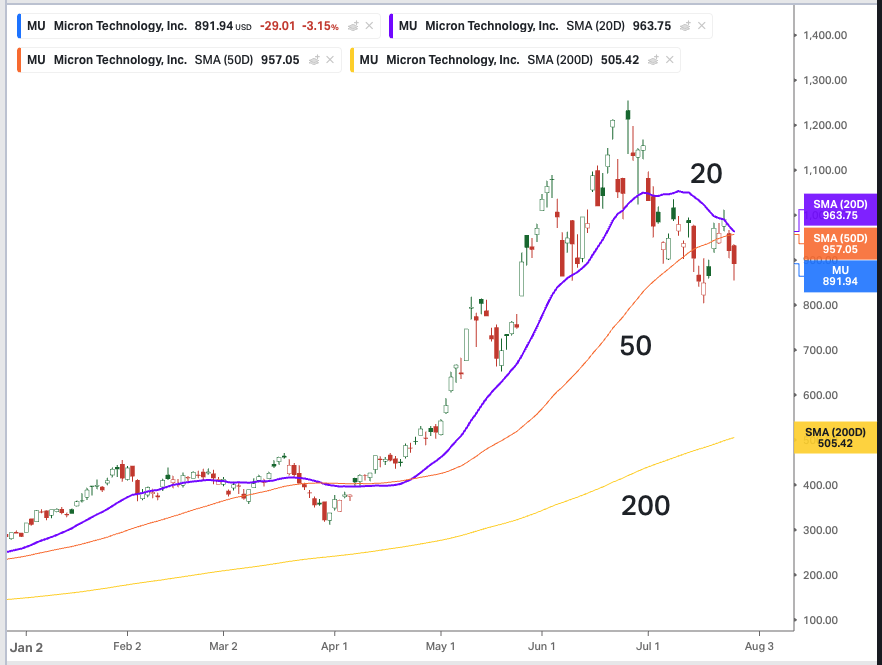
The 20-day moving average is built for speed. It’s quick to reflect new price action, which makes it valuable for traders looking to catch short-term trend shifts early — but that same speed means it’s more prone to false signals when a stock is choppy. Read the full 20-day moving average guide →
Sami Abusaad rates the 20-day as his #1 indicator by far:
The 50-day moving average sits in the middle. It captures enough recent price action to stay relevant, while smoothing out enough noise to avoid most short-term whipsaws. It’s often considered the most versatile of the three, useful across trend-following, swing trading, and momentum strategies. Read the full 50-day moving average guide →
The 200-day moving average is the long-term benchmark. Traders and financial media alike use it as a simple gut-check: above the 200-day, the long-term trend is considered bullish; below it, bearish. It’s slow to turn, but that slowness is the point — it filters out virtually all short-term noise. Read the full 200-day moving average guide →
There’s no single “correct” moving average — a day trader watching a 5-minute chart may care most about a 20-period MA, while a long-term investor may check a stock’s position relative to its 200-day once a week.
Golden Cross and Death Cross
Two of the most widely discussed moving average signals involve the 50-day and 200-day moving averages crossing each other.
However, you’ll hear the term “Death Cross” more frequently because of the fear they instill.
What Is a Golden Cross?
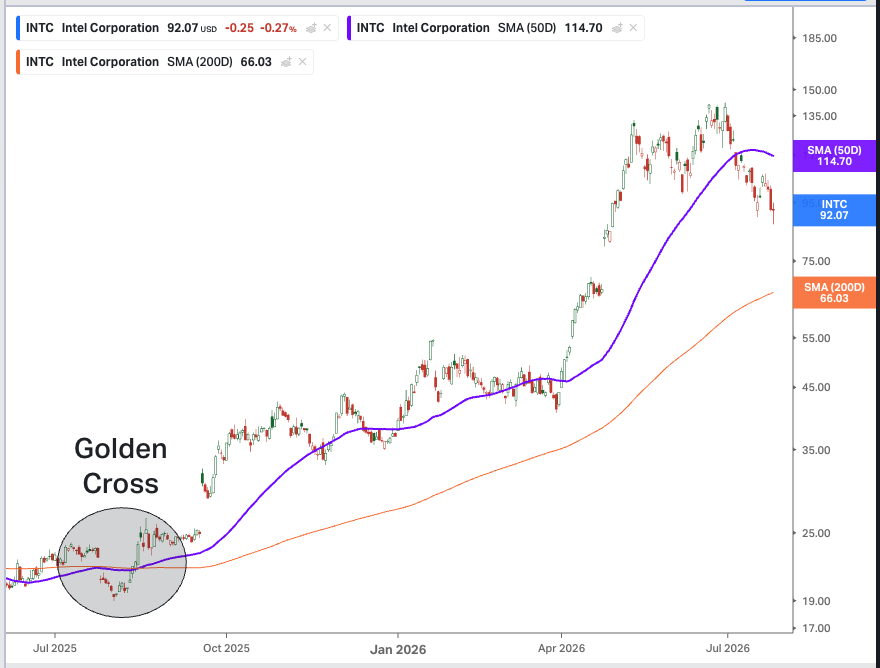
A Golden Cross occurs when the 50-day moving average crosses above the 200-day moving average. It’s widely interpreted as a bullish signal, suggesting that intermediate-term momentum is starting to outpace the long-term trend.
In this case, Intel (INTC) rose sharply after its 50-day crossed above its 200-day:
What Is a Death Cross?
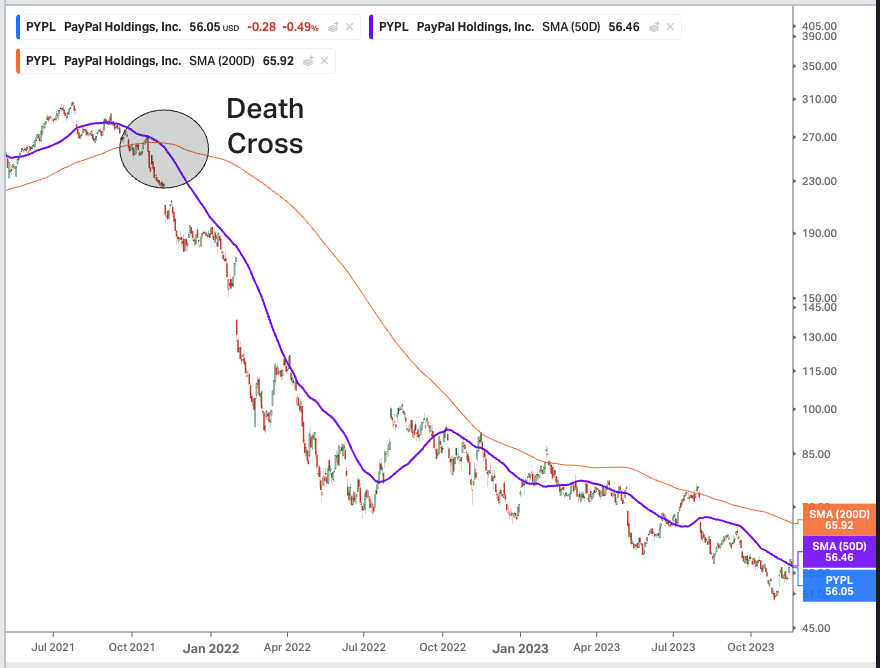
A Death Cross is the opposite: the 50-day moving average crosses below the 200-day moving average. It’s interpreted as a bearish signal, suggesting deteriorating momentum relative to the long-term trend.
PayPal (PYPL), one of the most troubled stocks in the market in recent years, had a dramatic Death Cross in late 2021.
An outrageous decline soon hit:
Why These Signals Get So Much Attention
Golden Crosses and Death Crosses are simple enough that financial media, casual investors, and professional traders can all understand them at a glance.
Because so many market participants watch for these crossovers, they can become somewhat self-fulfilling: the signal draws attention, and that attention drives trading activity that reinforces the move.
We searched Google News for “Death Cross,” and there were plenty of articles with titles like:
“Silver Price Analysis – Silver Tests $60 Level as Death Cross Confirms Trend”
“Gold is on the verge of a ‘death cross’ that could surprisingly foreshadow gains”
“Bitcoin Breaks Heavy Resistance—But Death Cross Looms: Analysis”

That said, both signals are lagging by nature — since they rely on two already-lagging indicators crossing each other, they often confirm a trend well after it has begun. They’re best used as confirmation tools alongside other analysis, not standalone buy or sell triggers.
How Traders Use Moving Averages: Core Strategies
Beyond individual timeframes, there are a handful of strategies that apply to moving averages broadly.
Trend Identification
The simplest use case: if price is trading above a moving average, the trend is generally considered bullish. Below it, bearish. This works with any timeframe, though longer MAs (like the 200-day) are typically used for overall trend direction, while shorter MAs (like the 20-day) are used for near-term trend reads.
Support and Resistance
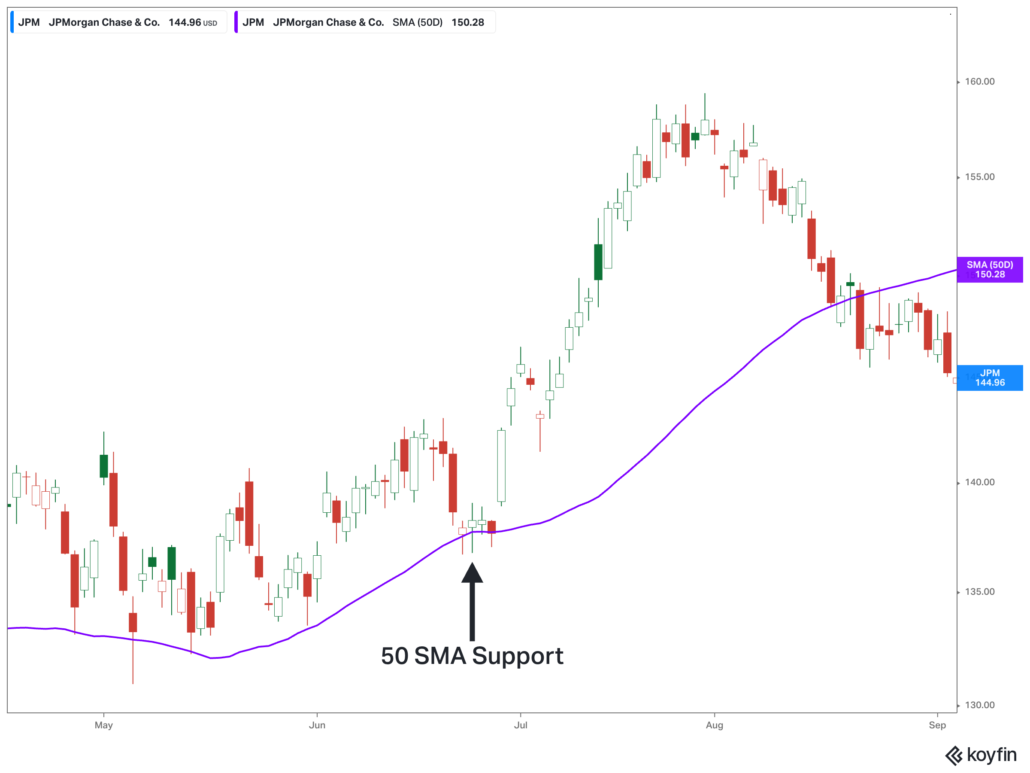
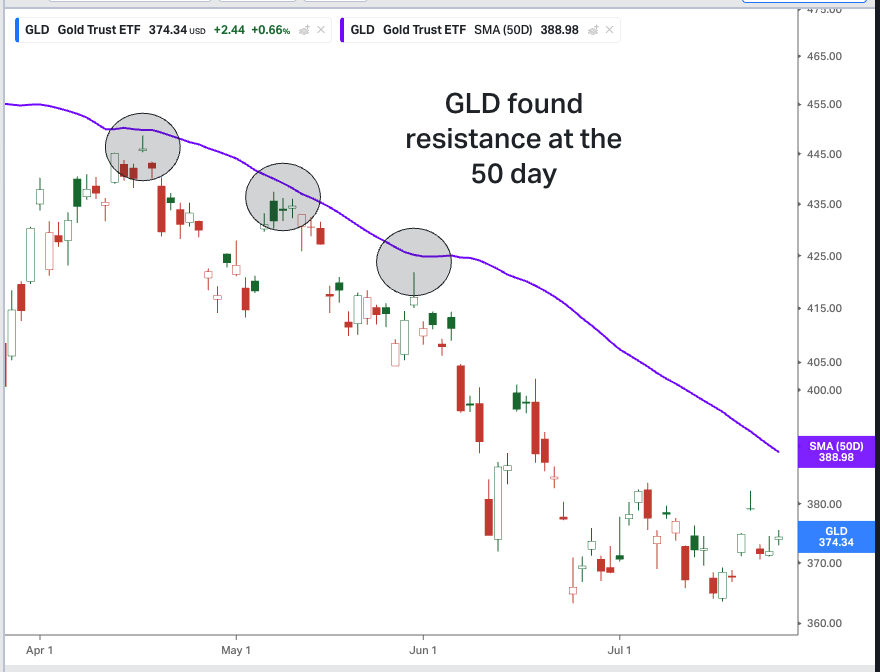
Moving averages often act as a floor (support) during uptrends or a ceiling (resistance) during downtrends. Traders watch for price to bounce off a moving average as a potential entry or exit point.
Here’s an example of the bank stock JP Morgan (JPM) finding support at the 50-day:
And here is the 50-day moving average functioning as resistance for the GLD ETF:
Crossover Signals
When a shorter moving average crosses above a longer one, it’s often read as a bullish signal (the Golden Cross being the most famous example). The reverse — a shorter MA crossing below a longer one — is read as bearish.
You saw examples of this before with the Golden Cross and Death Cross.
Combining Moving Averages With Other Indicators
Moving averages are rarely used in isolation. Many traders pair them with indicators like the Relative Strength Index (RSI), MACD, or Bollinger Bands to confirm signals before acting on them.
Risk Management
Moving averages are also commonly used to set stop-loss levels. A trader in a long position, for example, might place a stop slightly below the relevant moving average. That helps you use it as a dynamic, trend-following risk boundary rather than a fixed price point.
Pros and Cons of Moving Averages
Pros:
- Simple to calculate and understand, even for beginners
- Available on every charting platform, including free ones
- Provide an objective, rules-based read on trend direction
- Flexible: can be applied to any timeframe or asset (even cryptocurrencies)
Cons:
- Lagging by nature because they only reflect past price action (not future direction)
- Prone to “whipsaws” or false signals, especially in choppy, range-bound markets
- No single timeframe works for every trader or every market condition
- Should not be used as a standalone trading system
Which Moving Average Should You Use?
The right moving average depends on your trading style and time horizon, not on which one is “best”:
- Day traders often lean on shorter moving averages (20-period or less, sometimes on intraday timeframes) for fast-reacting signals.
- Swing traders tend to use the 20-day and 50-day together, balancing responsiveness with reliability.
- Position traders and investors typically anchor to the 200-day moving average to stay aligned with the long-term trend.
Many traders don’t pick just one — they watch multiple moving averages together (commonly 20, 50, and 200-day) to get a fuller picture of short, intermediate, and long-term trend alignment.
Conclusion
For a deeper look at any individual timeframe, check out our full guides on the 20-day, 50-day, and 200-day moving averages.
Moving averages are one of the simplest tools in technical analysis — and also one of the most powerful, precisely because so many traders and investors watch the same lines. Whether you’re using a Simple or Exponential Moving Average, and whether your focus is the 20-day, 50-day, 200-day, or all three together, the key is matching the tool to your trading timeframe and using it alongside other confirmation signals, not in isolation.
To Learn More About Moving Averages
If you’d like to get a better understanding of how moving averages can be used to find winning trade ideas, check out Scott Redler’s free eBook, “The Ultimate Guide to Moving Averages.”