
EVENT: 3 Strategies Working Right Now
David Prince shows you EXACTLY how to find big wins:
*By opting in, you consent to receive content and promotional emails from T3 Live.

Permabulls always say everyone’s bearish. And permabears always say everyone’s bullish. But let’s look at the actual numbers to see how the crowd actually feels. Last week, the overall mood of traders shifted to neutral from the prior week’s extreme bearishness. With the healthcare vote, earnings from AAPL/AMZN/FB/TSLA, and the April nonfarm payrolls report out of the way, let’s see how traders are feeling ahead of this weekend’s French election. (click here for a primer on these 5 sentiment indicators) 1) VIX Spread: Bullish The VIX dropped under 10 this morning, and the 3-month spread is at +3.98. This means that traders are fairly bullish. 2) CNN Fear & Greed Index: Neutral The Fear & Greed Index is at 45, down from 48 last week. F&G operates on a 1-100 scale, and a reading of 45 means traders are neutral. 3) AAII Sentiment: Neutral The latest AAII Sentiment Survey shows that 38.1% of individual investors are bullish,basically unchanged from last week. This is right in-line with the long-term average of 38.5%. 4) CBOE Equity Put-Call: Bearish The CBOE Equity-Put Call ratio was at 0.77 yesterday with a 3-day moving average of 0.69. This indicates that traders are bearish. 5) ISE Sentiment: Bearish The ISE Sentiment Index is at 65 as of the Thursday close (65 calls bought for every 100 puts). The 10 day moving average is just 88.2. So the recent trend shows higher put option demand. The big drop ahead of Friday’s NFP report has me slotting this number in at bearish. Conclusion Out of 5 sentiment indicators, we have: 1 bullish 2 neutral 2 bearish So traders have gotten more negative since last week, when we had 1 bullish, 4 neutral, and 0 bearish sentiment indicators. Last week, I wondered whether sentiment was about to go full-on bullish, but we saw precisely the opposite occur. Traders actually got more bearish, which is vert encouraging for the bulls. Judging by yesterday’s surge in put option demand (as indicated by the CBOE equity put-call ratio and the ISE Sentiment Index), traders were hedging aggressively for today’s NFP report and this weekend’s French election. This means there’s a lot of bearish bets that will need to be unwound in a jiffy if we get a Macron victory in France. I don’t think Marine Le Pen can be counted out until the final vote is tallied, but it certainly looks like Macron is in the driver’s seat. Call me crazy, but I think SPX makes new all-time highs above 2401 by Monday at 9:45 a.m. ET. (not that 8 points is a meaningful move in the grand scheme of things…)
Continue Reading -->
If you want to be an expert swing trader, then you have to understand the Foundation of stock movement, broken down into 4 clear stages: Ambivalence Greed Indecision Fear In our latest swing trading tutorial (scroll down to see it), T3 Live’s Director of Education Sami Abusaad breaks down each of these 4 stages so you can understand The Foundation — or the entire life cycle — of price movement. Most traders are not even aware these stages exist. But once you understand how they work, you’ll start viewing the market action through a clear new prism. You’ll see how greed and fear show their hands through price and trend action. So watch this video today and learn: Which market stage offer the highest reward relative to risk How to pick the best stocks for swing trading The single most important trading picture you may ever see Why Sami doesn’t try to buy at the exact bottom and sell at the exact top The right time to start putting on buy setups What to do when a stock goes climactic to the upside What to do when a stock goes climactic to the downside The danger of the “Fear of Missing Out” Why you can’t wait to be 100% sure to get in The type of behavior that leads to climactic tops
Continue Reading -->
There are a million courses and instructional videos on chart reading, economics, fundamentals, and quantitative analysis. Most traders come up through the ranks by taking information from various sources and mixing it together to create an individual path. You don’t need to be original or overly creative to be a great trader. You must simply be able to curate strategies that work for your personality and trading style. But the ugly truth is that a lot of trades desperately need a wake-up call. Sometimes, we think we’re putting things together in a very rational and controlled fashion, but we’re still not getting the result we should. That’s often a failure of mindset rather than of intelligence or natural trading acumen. So we put together a list of 9 clear signs that you need a trading intervention. If you suffer from 1 or more of these symptoms, then it’s time for a gut check! 1) You Suffer from Brain Freeze (and we don’t mean the ice cream kind) You do your best to learn a strategy or methodology, but when it comes time to implement it, you freeze up and do nothing. Quite often, traders are more comfortable with the idea of risk than risk itself. When traders find themselves freezing up, it often makes sense to dramatically cut position sizes to get acclimated to executing real trades. 2) You Make Conscious Errors You realize that you are doing something that does not fit into a logical strategy, and yet you do it anyway. This is a bizarre mix of anxiety and arrogance, as it’s based on two illogical beliefs: that doing something is always better than doing nothing, and that things will miraculously work out in your favor. Both are wrong on all counts. 3) You Are Underconfident You exit winning trades too early, stunting the potential of your winners. As unusual as it seems, traders often have difficulty letting winners run. Many traders want the security of having locked in a gain, which means they miss the bulk of a move. The best traders look for clear signs of exhaustion in trends before exiting winners, because trends often last longer than may seem logical. 4) You Have Too Much Patience You exit trades too late, allowing your winners to turn to losers, and losers to turn into bigger losers. This comes back to the belief that things will somehow just work out. Many traders have a problem with wanting more! more! more! out of a winning trade, even after it’s showing signs of of change in trend. So they’ll let emotion take over, and they’ll watch a position decline in the hope that it will magically turn around and restore prior gains. Traders also sometimes have a hard time dealing with losses, so they’ll sit and wait for them to turn around, even when they have no rational reason for doing so. 5) Not Enough Patience You chase trades aggressively, giving yourself bad entries, which eventually causes you to get stopped out. The fear of missing out is pervasive among traders. We see a stock go up $10 and we start to wonder if it’s going up another $5. A smart trader accepts that sometimes, trades just pass you buy. You’re never going to catch them all, and trying to do so means acting out of emotion instead of logic and analysis. 6) You Don’t Take Responsibility for Your Results You blame others for your problems trading problems instead of taking responsibility. We can’t control anything in the markets beyond our own strategies and risk management techniques. But since we all consenting adults engaging in an uncertain business, we must accept responsibility for our own results. We’ve all stepped into this arena by choice. So we must own the consequences — both good and bad. 7) Your Stop Get Hit Constantly You are dying of a thousand paper cuts, getting stopped out constantly, which adds up to huge losses. Many traders set extremely tight stops, which is death in today’s volatile, algorithm-driven markets. There is a misplaced belief that hard stops ensure limited losses, but that’s not always the case. A stop strategy must be adapted to current market conditions, and if you are getting consistently stopped out, you must reassess your thresholds. Quite often, traders that suffer from an overload of stop losses find that they’d actually have profited if they’d held on a little bit longer, or set their stops a little looser. 8) You’ve Forgotten That Trading Is Work It’s easy to view trading as an unstructured entrepreneurial adventure rather than a job. It takes a big streak of independence to become a trader. But beware of too much of a good thing. Traders often find themselves living an unhealthy lifestyle, including bad sleep habits, heavy hunk food intake, and zero exercise. If you want a healthy trading mind, you must take care of our body of first so you can show up ready to work effectively every day, just like any other job. When you’re tired, unfocused, and unprepared, you are throwing money away. 9) You Are Not Compartmentalizing We all have life problems. But when we trade, they must be put away to be dealt with later. You must be focused on the task at hand. You can’t be thinking about the fight you had with your spouse the night before or how you’re going to make the next mortgage payment. So when it’s time to trade, stay focused on the task at hand.
Continue Reading -->With April 2017 coming to a close, let’s take a quick look back to our 10 most popular articles of the month, as judged by our internal website statistics. We’ve got everything from education on the VIX to technical analysis tips to Scott Redler’s latest appearance on CNBC’s Fast Money. Enjoy them! 10) What is the VIX? And How Can I Trade It? – April 20 Learn the basics of the VIX, and how you can trade instruments based on the VIX. 9) How the 3-Bar Rule Can Help You Deal with Failed Setups – April 10 Learn to avoid setups that look like they are triggering, but actually fail. 8) Oh Snap! A Unique Options Opportunity Presents Itself – April 18 Snap options looked unusually priced ahead of the May earnings report, presenting an opportunity to place an interesting options trade. 7) Jeff Cooper: Gold $1262 Is the Level to Watch – April 10 Jeff Cooper breaks down the levels you need to be watching in gold. 6) 9 Tips for Picking the Right Stocks for Swing Trading – April 4 As a swing trader, one of the most important decisions you’ll every make is choosing which stocks to trade in the first place. 5) How to Use the VIX Curve to Judge the Market’s Mood – April 17 The VIX isn’t very useful as a market indicator. But looking at the curve can tell you a lot about the market’s mood. 4) 7 Interviews with 7 Top Traders – April 1 Get to know 7 of our top traders, including Sami Abusaad, Kurt Capra, and Mark Harila in this exclusive interview series. 3) Jeff Cooper: Why a Big League Market Reversal Could Happen – April 6 Technical analysis maestro Jeff Cooper identifies market levels that could signal a major change in trend. 2) 17 Killer Tips Every Momentum Trader Should Know – April 3 Most successful traders are highly disciplined. So to help you get better momentum trading results, we’ve put together a list of 17 handy rules that will keep you out of trouble. 1) Scott Redler: 4 Charts You Need to See – April 10 Scott Redler laid out his case for the banks on CNBC’s Fast Money. Here are the 4 charts he used to break down the action.
Continue Reading -->
Permabulls always say everyone’s bearish. And permabears always say everyone’s bullish. Neither side ever provides real evidence of their views. But let’s look at the actual numbers to see how the crowd actually feels. Last week, traders were undeniably bearish. Specifically, they were loading up on put options like there was no tomorrow, which provided a ton of upside fuel after Macron scored a victory in the first round of the French Presidential election. So let’s see if sentiment has lifted with this week’s surge, which drove the Russell 2000 and Nasdaq to fresh all-time highs. (click here for a primer on the 5 sentiment indicators listed below) 1) VIX Spread – Bullish The VIX has dropped like a rock this week, and the 3-month spread is at 3.27. This means traders are moderately bullish. 2) CNN Fear & Greed Index – Neutral The Fear & Greed Index is now at 48, up from just 34 last week. F&G operates on a 1-100 scale, and a reading of 48 is smack in the middle, meaning traders are neutral. 3) AAII Sentiment – Neutral The latest AAII Sentiment Survey shows that 38% of individual investors are bullish, a huge jump from last week’s 25.7% reading. While this is a major jump, it’s right in-line with the long-term average of 38.5%. So it’s neutral. 4) CBOE Equity Put-Call – Neutral The CBOE Equity-Put Call ratio was at 0.63 yesterday with a 3-day moving average of 0.62. This indicates that traders are neutral. This is a pretty big decline from late last week, when traders were scooping up puts like there was no tomorrow. 5) ISE Sentiment – Neutral The ISE Sentiment Index is at 92 (92 calls bought for every 100 puts). The 10 day moving average is just 88.4. So the recent trend shows higher put option demand. However, I’ll actually call this neutral because the ISE Sentiment index has been so down for so long that I’ll count these readings as neutral. One thing to keep in mind: for the past few months, I’ve found that the ISE Sentiment Index hasn’t been terribly helpful in terms of judging sentiment. I believe its measurement methodology is very well thought-out, but even so, the results haven’t been all that helpful. I wrote more about that topic here. So I’m taking the time to consider swapping it out with another indicator. Conclusion Out of 5 sentiment indicators, we have: 1 bullish 0 bearish 4 neutral This is a big change from last week, when we had 0 bullish, 4 bearish, and 1 neutral. So we went from stretched markets with bearish sentiment, to even more stretched markets with neutral sentiment. Now, the big question is whether sentiment’s about to go full-on bullish. We’ll know more tomorrow. After the close today, we’re getting an avalanche of earnings from the likes of Google (GOOGL), Amazon (AMZN), Starbucks (SBUX), and Intel (INTC), all of which are major Nasdaq components. Incidentally, those reports should also dictate whether SPX is about to vault over the prior 2400.98 all-time high set on March 1. And don’t forget, #1 index heavyweight Apple (AAPL) reports on Tuesday, and it too will play a key role in the near-term action. So keep an eye out — if we get stronger equity market action in the next few days, sentiment could head to full-on froth!
Continue Reading -->
The ETF industry is HUGE. According to the Investment Company Institute, as of February 2017, we have 1,736 ETF’s to choose from, with total assets of $2.7 trillion. There’s an ETF for everything. Yes, we all know about SPY and QQQ and IWM, but did you know that there’s an ETF for lithium? That’s right, you can ride the lithium market with the Global X Lithium (LIT) fund. Into livestock? Then check out the iPath Dow Jones-UBS Livestock Subindex Total Return (COW). (h/t to RothIRA.com) Heck, there’s even an ETF that invest in ETF companies… albeit not very well. To help you make sense of the endless array of ETF’s available to you, we’re going to give you 5 basic ground rules to keep you away from the worst of the ETF lot. 1) If It’s New, Tiny, or Illiquid, Stay Away New ETF’s tend to be expensive and illiquid, with plenty of alternatives that are already on the market. Plus, a hot new fund may not actually ever garner enough assets to stay in business. So why bother with them? According to ETF.com, once a fund surpasses $50 million in assets, it’s far likely to close, so that’s a decent benchmark to keep in mind. However, we’d suggest upping your minimum requirement to $250 million to reduce the likelihood of a fund closure during times of extreme market stress. And if you’re an active trader, look for funds that trade over 1 million shares per day. This will ensure you can get in and out of them without too much trouble. 2) Forget Those Highly Specialized Sector Funds As with many new ETF’s, highly specialized sector funds are usually not worth trading. Specialty funds are typically more expensive and less liquid than generalized funds with similar performance characteristics For example, the Bioshares Biotechnology Clinical Trials Fund (BBC) sounds exciting, but it trades less than 13,000 shares a day. It also has an expense ratio of 0.85%. The iShares Nasdaq Biotechnology ETF (IBB) trades over 1 million shares per day with an expense ratio of 0.47%. Here, you can see a chart comparing IBB (bars) to BBC (purple line): They look pretty much the same, though BBC has been more volatile and a weaker performer over this 2-year time frame. 3) Know What You Own Before trading an ETF, you should actually make sure it fits your trading and investment objectives. Always look at a prospective fund’s underlying holdings, because you can’t always rely on a fund’s name to determine what it owns. For example, the SPDR Homebuilders ETF (XHB) is more of a retail/building supply ETF than a homebuilders ETF. Only 1 of its top 10 holdings is a homebuilder, and the biggest position is Williams-Sonoma (WSM)! And if you’re playing with anything fancy like leveraged ETF’s or VIX-derived products like VXX and TVIX, run, don’t walk, to the prospectus. Quite often, these complex products have significant tracking errors and other risks of which you should be aware. 4) Check Your Free Options Many large brokerage firms allow you to trade certain ETF’s for free. Every dollar you save on commissions is another dollar that stays in your pocket, so why not look into your free options? For example, Fidelity offers commission-free trading of the popular iShares ETF’s. TD Ameritrade also offers free trading of select ETF’s from iShares and Vanguard. However, there are two caveats to keep in mind: there are usually some restrictions with free ETF trading, like a minimum 30-day holding period. And secondly, some ETF’s offered in commission-free trading programs aren’t exactly top-shelf offerings. Occasionally, you’ll come across a fund that has very little liquidity and a high expense ratio, which you’ll want to avoid. 5) Stick With the Establishment Most of the time, it makes sense to stick with the industry giants like Vanguard, iShares, State Street SPDR, and PowerShares. In all likelihood, these companies will stay in business and remain very profitable for a very long time. And because of rampant competition, fees just keep going lower and lower. Plus, funds from major ETF companies, allowing you to get in and out of the market at will. It’s just one of those cases where bigger is almost always better.
Continue Reading -->
Permabulls always say everyone’s bearish. And permabears always say everyone’s bullish. Most of the time, neither actually gives evidence for their views. That’s why we started T3 Live’s Weekly Sentiment Update. Our Weekly Sentiment Update eliminates opinions, feelings, hunches, and preconceived notions. That lets us strictly focus on the numbers and get a more accurate idea of just how bullish the crowd is. To do this, we take 5 sentiment indicators, break each one down, and then analyze what they mean as a whole. Why 5? Simple — lone sentiment indicators contradict each other all the time. At any given time, one sentiment indicator can read bullish, and another can read bearish. So it’s best to use a variety before forming an opinion. And the 5 we use are all available to the general public without any expensive subscriptions. Here they are, in no particular order: 1) VIX Curve If you understand the basics of the VIX, then you probably know that the VIX alone is useless as a sentiment indicator. And it has little value as a predictor of price. However, by comparing the spot price of the VIX to forward futures prices, you can get an idea of just how much volatility traders are pricing in. For example, if the spot VIX price today is 20 and the 3-month future is 18, that means that traders are pricing in significant short-term volatility. That of course means they’re bearish. Click here for a detailed primer on the VIX Curve 2) CNN Fear & Greed Index The CNN Fear & Greed Index uses a variety of factors including market momentum, junk bond demand, and market volatility to judge whether traders are more fearful (bearish) or greedy (bullish). I’m a big fan of this index because it operates on a simple 0 (extreme fear) to 100 (extreme greed) scale, which eliminates a lot of guesswork. If you’re going to choose only 1 sentiment indicator to follow (which I don’t recommend), this is probably the one to pick because it focuses on actual market activity than polls and surveys. 3) American Association of Individual Investors Sentiment Survey Speaking of surveys, every Thursday, I look forward to the release of the AAII Sentiment Survey. The AAII Sentiment Survey tells us whether individual investors are bullish, bearish, or neutral for the next 6 months. Since individual investors tend to get too bullish at tops and too bearish at bottoms, it’s good to know where they stand. AAII also provides in-depth commentary with its weekly Sentiment Survey data, which is very helpful in making comparisons to historical trends, and in figuring out what’s actually driving public opinion on the market. 4) Chicago Board Options Exchange Equity Put-Call Ratio The CBOE Equity Equity Put-Call Ratio tells us how many put options are traded vs. the number of calls. Reported at the end of each day, the CBOE equity-put call gives us a rough idea of how equity options traders view the market. On average, about 0.65 puts trade for each 1 call every day. When we see major shifts from that long-term average, it can indicate an extreme in sentiment, and a potential trend change in the market. 5) ISE Sentiment Index The ISE Sentiment Index is similar to the CBOE Put-Call ratio, but it has a few interesting twists to it. While many options-derived sentiment indicators are put-call ratios, the ISE Sentiment Index is actually a call-put ratio. The ISE also uses only opening long customer transactions, and eliminates market maker and firm trades. This discards many trades that are not clear bullish or bearish bets from sentiment calculations. For example, shorting puts is actually a bullish trade, and market makers may trade calls and puts strictly to hedge other transactions they make. The ISE also operates on a scale of 100, with 100 representing equal demand for calls and puts. And unlike the CBOE Equity Put-Call, the ISE is reported every 20 minutes on a slight delay. But bizarrely, even tough the ISE Sentiment Index seems better designed, since late December, I’ve found the CBOE Equity Put-Call Ratio more helpful. How You Can You Use Sentiment Indicators in Your Trading Typically, it’s better to buy when sentiment is very bearish, and it’s better to sell when sentiment is very bullish. But you must keep a few things in mind. First, analyzing sentiment is more art than science. Yes, we’re dealing with numbers, but I can tell you from experience that trying to turn them into buy or sell signals through quantitative analysis is extraordinarily difficult. Plus, extremes in sentiment can last quite a long time. For example, as of April 2017, the ISE Sentiment Index has been bearish for months and months. So don’t use sentiment indicators as buy or sell signals on their own. Just treat them as another piece of the puzzle, and incorporate them into your overall market and trend analysis. Let’s take the April 23 French election. After analyzing the 5 sentiment indicators listed above, I determined that traders were very bearish ahead of the news. Traders were clearly pricing in a negative outcome (namely, a victory by far-right populist Marine Le Pen). So if I had wanted to bet on a positive outcome, I would have been encouraged by the bearish sentiment. Why? Because when traders are very negative, positive news can drive huge rallies, which is exactly what we saw on April 24.
Continue Reading -->
The market is certainly pleased with the first round of the French Presidential Election. Emmanuel Macron scored a victory and is apparently in the driver’s seat to win the May 7 runoff against far-right populist Marine Le Pen. Le Pen supports a vote for a French exit of the election, and assuming Macron wins, a so-called “Frexit” may be off the table. I wouldn’t count Le Pen completely out just yet though. We’re still living in an era with the Brexit, President Trump, and Italy’s ‘No Vote.’ So anything is possible. Today, the SPX is up 1% and within striking range of the 2401 all-time high. XLF is up 2.4%. The euro is up 1.3% against the dollar. The French CAC 40 index is up 3.9%. And the VIX is down a whopping -23%. So why is this happening? Why are we making such a big move? It’s simple: the bears built a big, big fire. And then they fell in it. Last Thursday afternoon, I pointed out that trader sentiment was looking very bearish heading into the weekend election. As you probably now, the permabears have been out in force saying that everyone’s complacent. But the numbers showed otherwise. For example, the American Association of Individual Investors showed that just 25.7% of individual investors are bullish. That’s well below the long-term average of 38.5%. And as of Friday’s close, the 10-day moving average of the CBOE Equity Put-Call Ratio was 0.703, indicating that traders had been stocking up on puts ahead of the weekend. The last time it was that high was February 8, 2017, when SPX closed at 2294.67. The index then hit 2400.98 on March 1. And then, there’s the ISE Sentiment Index, which measures call options demand relative to put option demand using only opening long customer transactions. (market maker and firm trades are excluded) Its daily average has been just 84 this year, or 84 calls bought for every 100 puts. That’s well below long-term average readings. So there was certainly no shortage of bears heading into the weekend. (h/t to Marc Eckelberry for pointing this stat out on the Virtual Trading Floor® (VTF). And when you get a lot of bears bracing for a negative outcome — like a Le Pen victory — that means there’s ample fuel for a rally if the news is positive, or even neutral. The Lesson to Be Learned High stock prices and valuations do not necessarily equate to bullish sentiment. At its root, a bull market happens when there are consistently more optimists (buyers) than (pessimists) sellers. But even with us within 2% of all-time highs, the data shows that there’s still an awful lot of folks that are braced for downside. It doesn’t seem to make a whole lot of sense… but when is anything involved with the market perfectly logical?
Continue Reading -->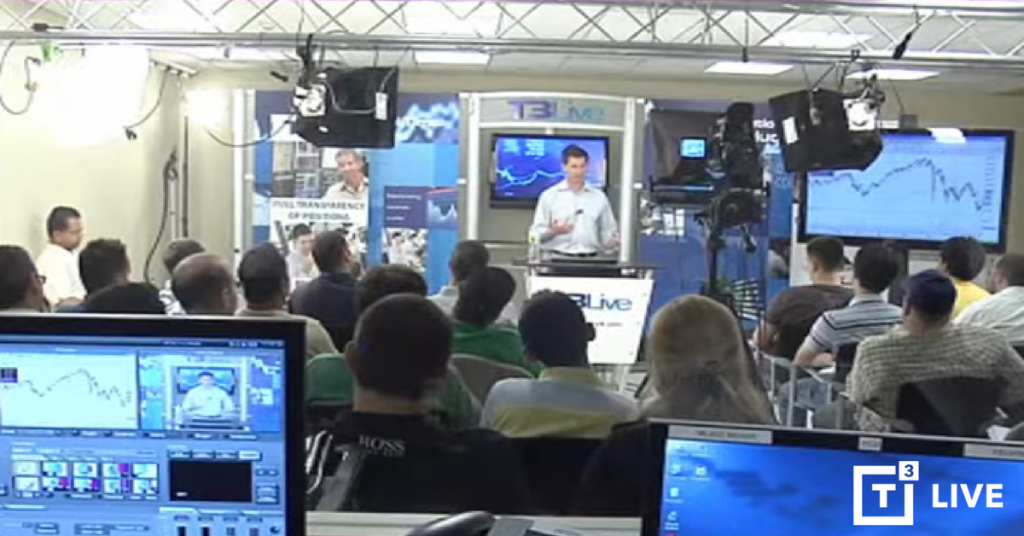
T3 Live Weekend Recap 4-22-17 | Trade Ideas-Trader EducationT3 Live Training Facility NYC-NYWhy SPY Could Hit New All-Time HighsIt was tough to see this one coming.After reversing to finish on the lows Wednesday, SPY gapped up Thursday morning. And following a small, quick pullback, it took off running higher straight through into the afternoon.It reclaimed the 20 day sma (234.71) — barely even pausing — and continued up above the 50 day sma (235.46). It settled into a relatively tight range above the 50 day sma for most of the afternoon but dropped right before the bell to finish a few cents underneath it. The move as on above average volume.So a week of bearish action was wiped out in one face-ripping rally. Reclaiming the moving averages was a big positive for the bulls. CONTINUE READING == >>How the 3-Bar Rule Can Help You Deal With Failed SetupsOur Trading the Pristine Method® Home Study Course teaches traders a unique approach to trading candlestick price patterns.What make it unique?It is 100% objective and systematic, and eliminates all guesswork from the buying and selling process. We teach identifiable patterns that stocks trade in, and then show the exact strategies of what to do in each stage of a stock’s movement, including how to enter, manage, and exit the trade.That said, not all trades work. No pattern makes money 100% of the time, and the failures must be watched for 3 reasons:1) To see and capitalize on a “new opportunity” when a pattern fails but immediately sets up again2) To know how best to manage a position before it fails by evaluating the charts objectively.3) To help you in disaster management mode in the event you are in a position that has failed. CONTINUE READING == >>Register Today | Rob SMith Webinar Monday April 24 | 4:30 PMRegister TodayQuant Edge Training: A New Way to Read Charts 4 Charts You Need to SeeThe market’s been stalling since the 3/1 gap up on Trump’s speech. And lately, we’ve been seeing weakness in the banks, even the ones reporting good earnings, which has traders worried about more downside. I discussed some of the key players like Bank of America (BAC) and Goldman Sachs (GS) this afternoon on CNBC’s Fast Money: So let’s take a step back and take a look at 4 key charts to get an idea of where we stand. 1) S&P Financial Sector ETF (XLF)I actually also appeared on Fast Money on March 22 to discuss XLF, which had lost momentum by breaking the 8 & 21 day moving averages.You can see the March 22 segment here: CONTINUE READING == >>Trader Training | 9 Tips for Picking the Right Stocks for Swing TradingAs a swing trader, one of the most important decisions you’ll every make is choosing which stocks to trade. You can learn all the winning setups in the world, but if you trade the wrong stocks, you’re going to lose money. So we’ve put together 9 simple tests that can help you steer clear of the ticking time bombs, and keep you focused on the winners. GET THE 9 TIPS HERE == >Is Prop Trading Right for You? Take Our FREE Quiz and Find Out! TAKE THE QUIZ Scott Redler: Market Thoughts Ahead of the French ElectionIt’s been a very choppy week.I wish I had more commitment to a direction, but I just don’t.Technicals are very mixed. The Oscillator is neutral, not oversold or overbought. SPX is almost smack in the middle of the range from the 2400 high to the 2322 low.We are close to reclaiming all the moving averages, but there’s no real conviction. Tech still shows relative strength.Small caps and banks had a bounce off recent support, but I’m not sure if they are out of the woods. Bios are still hanging in, but no one is paying up. XLE is still brokenRead Scott’s Game Plan for Next Week == >>Scott Redler Watch the Video Today | Duration 30:15GET THE NEW TRAINING PODCAST | T3 CEO Sean Hendelman Discusses the Future of Automated TradingOn March 15, 2017, Sean Hendelman, CEO and co-founder of T3 Live and T3 Trading Group, appeared on the Chat With Traders podcast hosted by Aaron Fifield. In this special interview, Sean discusses:How he got started as an investorImportant lessons he learned from losing moneyHow the automated trading space is evolvingThe challenges of latency-sensitive strategiesThe structure of T3 CompaniesJeff Cooper: The Bonfire of the Equities?In this today’s report, I couldn’t help but wonder whether investors/traders are giving short shrift to the idea of a big market event in the event of a Le Pen victory in France. After all, selling volatility and not buying insurance seems the smart move a la Brexit and the US election. Right? Maybe the very buying of insurance for those ‘non-events’ was one of the reflexive factors that perpetuated the rally phases following Brexit and the Trump Victory. Just because the house doesn’t burn down, you don’t cancel the fire insurance do you? I can’t help but wonder whether ‘wise guys’ are selling volatility here and that the 3rd time may be a charm for bears. History doesn’t always repeat of course, but we can learn a lot from it. CONTINUE READING == >>
Continue Reading -->
How can I make money trading the VIX? That’s one of the most popular questions we get from aspiring traders. And they usually don’t like the answer — because you can’t trade the VIX. The VIX — better known as the Chicago Board Options Exchange Volatility Index — is not a security, and thus the number you see on your screen is not a price. It’s actually a trading indicator. The VIX uses prices of various S&P 500 options with expirations between 23 and 37 days to measure traders’ expectations of volatility. The VIX helps us measure sentiment by telling us how much traders are willing to pay for these options. Typically, the VIX rises when traders are worried about downside risk. Why? Because when traders are worried about downside risk, they’ll pay higher prices for downside protection through options. Let’s take a look at a 10-year monthly chart of the S&P 500 (bar chart) against the VIX (purple line): The chart shows that the VIX had major spikes during the: A) Financial Crisis B) Flash Crash C) Euro Sovereign Debt Crisis D) August 2015 Minicrash This illustrates how the VIX rises when traders are scared and markets are coming under pressure. Why? Again, because traders were willing to pay up big for downside protection through S&P 500 options. The same dynamic plays out on shorter time frames. As you can see in this 20-day hourly chart, when the S&P 500 (bars) rises, the VIX (purple line) falls: And vice versa. What You Can Trade We told you before that you can’t trade the VIX directly, since it is an indicator. However, there are many derivatives of the VIX that can be traded. But before we proceed further, you must understand that virtually all VIX-related instruments can be tricky to deal with. And we urge you to read the prospectus and understand the pricing mechanics of any VIX-related instrument you trade. VIX Options and Futures The CBOE has created VIX futures and options. VIX futures trade nearly 24 hours, 5 days a week. And VIX options can be traded just as easily as a standard equity option. However, keep in mind that VIX options typically expire on Wednesday, and VIX options contracts are based on the price of VIX futures, not the VIX itself. VIX ETN’s There are many VIX-derived exchange traded products, the most popular of which is the iPath S&P 500 VIX ST Futures ETN (VXX). The VXX aims to deliver the return of the S&P 500 VIX Short-Term Futures Index. Many traders also follow the Credit VelocityShares Daily 2x VIX ST ETN (TVIX), which aims to deliver twice the daily return of the S&P 500 VIX Short-Term Futures Index. VIX ETN’s can be bought and sold like stocks. However, they only appropriate for short-term trading since they don’t track the VIX — they track VIX futures, which tend to naturally fall over time. Here’s a direct excerpt from the VXX prospectus: The index underlying your ETNs is based upon holding a rolling long position in futures on the VIX Index. These futures will not necessarily track the performance of the VIX Index. And for technical reasons related to the VIX futures term structure, they tend to decline over time: On the flip side, shorting these instruments over the long run is not easy because of margin requirements and other issues. Plain Old SPY Options The easiest way to trade changes in the VIX may be to just trade SPY options. They’re very liquid and easy to trade with none of the complex mechanics involved with VIX futures, options, and ETN’s. For example, if you think the VIX is set to increase sharply, rather than messing with VIX products, you could simply buy SPY put options. Why? Because a higher VIX means higher put options prices. Remember, the VIX is a measure of implied volatility on S&P 500 options. And all things being equal, when implied volatility goes up, options prices go up. (click here for a primer on implied volatility) And on the flip side, to speculate on a falling VIX, one could simply buy SPY call options, since a falling VIX is typically associated with rising stock prices. Sure, the VIX products are sexier and more exciting, but for newcomers to trading, simpler is often better.
Continue Reading -->