The Market Bounced Because Time & Price Cycles Aligned
- May 31, 2022
- / By Jeff Cooper
“If we wish to avert failure in speculation, we must deal with causes. Everything in existence is based on exact proportion and perfect relationship. There is no chance in nature, because mathematical principles of the highest order lie at the foundation of all things. Faraday said, ‘There is nothing in the Universe but mathematical points of force.'” – WD Gann
“What most people don’t seem to realize is that there is just as much money to be made out of the wreckage of a civilization as from the upbuilding of one.” – Gone With the Wind, Chapter 9
Those that have never invested or traded through several complete cycles of the market have seen the market demonstrate in just months the false premise that fundamentals such as a stock's earnings and price to sales ratios necessarily correlate with the price of a stock.
Many stocks have declined 60%, 70% – even 90% – since last year.
It’s not necessarily the company’s business or fundamentals that changed so dramatically that caused the price of a stock to plunge or to skyrocket in the first place. It can be fatal to confuse a company with the price of its stock.
Let’s look at three names, an upstart and, on the other end of the spectrum, the heart and soul of speculative sentiment, AAPL and TSLA.
UPST IPO’d in December 2020 and ran from 22 to 401, followed by an Eiffel Tower that three weeks ago saw UPST back to where it started.

Advanced technical analysis measures money flows.
But the “integration” of Time & Price underpin the sentiment that drives the flow of money.
Allow me to explain.
UPST’s opening trade was 26.
The Principle of Squares, as presented by master market operator WD Gann via his theory that the Law Of Vibration drives the stock market, shows that straight across and opposite the 26 region is the 401 region.

Green, 25/26
Pink, 401
Blue, early May
Following a 1 2 3 Pullback, it ripped to test the 50 region on Friday… within reach of its declining 20 day moving average for the first time since a massive Breakaway Gap on May 9 from the 77 region.

Green, 25/26
Pink, 401
Blue, early May
Following a 1 2 3 Pullback, it ripped to test the 50 region on Friday… within reach of its declining 20 day moving average for the first time since a massive Breakaway Gap on May 9 from the 77 region.

Let’s take a look at AAPL.
AAPL hit an ATH near 183 on January 4, 2021, the day the SPX peaked.

As posted on the Hit & Run private Twitter feed weeks ago, 360 degrees down from 183 gives 133.
AAPL struck a low of 132.61 on May 20 and reversed up with authority.
May 20 — the day the SPX struck a low for the decline… so far.


Friday it closed at 149.64 — just five trading days later.
Time points to price, price points to time.
In and of itself, AAPL was a superb tell for the rally phase that we forecast was on deck last week.
Let’s take a look at TSLA.
TSLA struck a high of 1152 on April 5.
As flagged on the Hit & Run private Twitter feed last week, straight across and opposite is 620.

TSLA dropped to 620 on May 24, followed by a 140 point rally in three days.

Pink 620
Blue 1150
Green May 20
Happenstance?

Let’s put the pieces together to see what the Square of 9 Time & Price Calculator forecasts for the SPX/SPY.
In November, we stated that “the SPX will get hit hard in January which would be the start of a strong downdraft.”
On January 4, the SPX struck an ATH of 4818.
The SPY’s ATH was 480. So moving the decimal point on the SPX 4818 ATH we get 481, and using the SPY we have 480/481.

On the Square of 9, notice that 480/481 conjuncts/vectors May 20. Remarkably, May 20 was the low for 2022 and a large range reversal day.
The SPX plunged 1008 points from 4818 to 3810.

Blue 480
Green May 20
The SPY CLOSING low for the move was 389ish on May 19.
The all-time high day was January 4, 2022.
Checking the Square of 9 shows January 4 is 180 degrees straight across and opposite 389.

Red, Jan 4
Green 389
Remarkable.
Time points to price, price points to time.
The Rule of Multiples holds that the more time/price factors line up, the stronger the likelihood that a turning point is on the table.
It was. The indication is a strong rally was due. Perhaps it will persist longer and carry further than the vast majority of market participants believe — even if that includes a test/undercut of last week’s low.
The Square of 9 is the only trading tool that integrates Time & Price. As depicted above, there were two Time/Price square-outs pointing to May 20 and the 389 region (which turned out to be the closing low).
So what happened? On May 19, the SPY carved out a closing low for 2022 and on May 20, the SPY struck a new low for the year before a strong reversal played out.
Moreover, on May 20, the SPY left a Soup Nazi buy signal… a strategy I created with my Hit & Run books in the late 1990s.
Allow me to explain.
Markets like to “test” when carving out lows and highs.
A Soup Nazi buy signal occurs when a stock or market makes a new 20 day low and then reverses back up the same day (or the next day) through the low of at least a 4 day interval or separation within the same 20 day lookback window.

The purpose of the 4 day interval rule is to avoid a continuation of the trend and identify a “test.”
In other words, for Soup Nazi buy, we have a low, a rally attempt and then an undercut test of the low that sees price jackknife higher (the reverse rules are true for Soup Nazi sell signals).
Often trend-followers will short new 20 day lows and buy new 20 day highs (there are generally 20 trading days in a month).
When price makes a new 20 day low but there is no downside follow through and subsequently price knifes up through the low of at least 4 bars prior but within the 20 day lookback, there is “no soup” for the trend-follower shorts.
“No Soup For You,” as the famous character from the Seinfeld Show would pronounce.
In sum, in keeping with WD Gann’s Law Of Vibration, the price movement of a stock or commodity unfolds in a coherent natural progression. This is because stocks and commodities are in essence centers of energies and these energies, or vibrations, are controlled mathematically.
When these price vibrations balance out (square-out) with certain cyclical influences, a change in trend may occur.
Gann, Wyckoff and Livermore all shared the common belief that cycles (periodic repetition) are present in the market and that price action is not always random. It is Gann who determined that there are time cycles AND price cycles and that when the two aligned, the likelihood of a turning point was strongest.
It is only the Square of 9 Wheel pictured below that integrates time and price, and when they setup the greatest opportunity may occur.
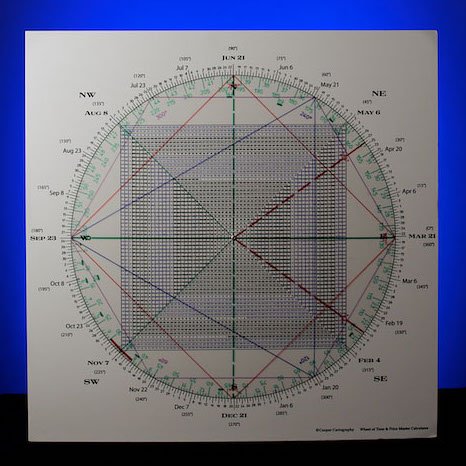
The financial and mainstream media wakes up at extremes. It took a while for the media to notice something new was playing out in the markets this year. 10 days ago, when time and price cycles indicated a rally phase, the stories about a bear market saw a massive spike.
My expectation is the intense wild swings will continue and short term buy and sell signals will be critical and opportunistic.
As always, we update the price projections given by the Square of 9 Wheel in these reports and on the Hit & Run private Twitter feed.
99.999% of traders have never even seen the Square of 9... let alone understand its potential.
Do you dare to be different?

Popular posts
99.999% of traders have never even seen the Square of 9... let alone understand its potential.
Do you dare to be different?