They say sentiment follows price. But if you look at the market as a supply and demand of emotions, you have to look under the surface and ask, what really drives sentiment? Are there swings in mood and psychology that are dominated by cycles?
What drives these cycles is not what this is about. But if you believe cycles exist, you have to be open to the idea that there is an underlying “natural” impulse (planetary and market) affecting the affairs of mankind just as the tides.
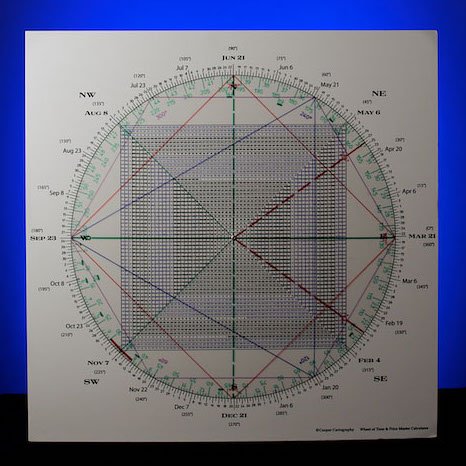
As WD Gann wrote, “Time is more important than price.” So we are always on the lookout as to when these TIME FACTORS set up.
“The only way to win the game is if you really see it, put all your eggs in one basket and watch the basket very carefully.” – Stan Druckenmiller
The key word in the above gem from Stan is “very.”
Markets turn on a dime; most traders cannot.
Friday markets turned on a dime to the topside as the SPX came within a fraction of an idealized price level: 4501, which is 180 degrees down from the 4637 recovery high.
Of course, this follows Thursday’s late turn which saw a plunge on the runoff.
Will the real turn please stand up?
The SPX turned on a dime late in Friday’s session with today being 90 days/degrees from the January 4 ATH.
Markets typically play out in these 90 degree decrements of time and price.
For example, note how the February 24 SPX low for the year is 90 days/degrees from the big November 22 turn date when the NAZ found high.
As well, the SPX satisfied a turn down in its 3 Day Chart on Friday… 3 consecutive lower daily lows.
This is the first time the index turned its 3 Day Chart down since the explosive rebound started off the March 14 low.
The SPX left a textbook 1 2 3 Pullback/180 buy setup as it also saw a close at/near session lows on Thursday with a close at/near session highs on Friday: a “180.”
The presumption is following a runaway move that the first turndown in the 3 Day Chart should define a low… at least for a test of the recent swing high… 4637.
However, notice that the SPX also turned its 3 WEEK Chart UP last week. It did so by tracing out 3 consecutive higher weekly highs.
This, of course, is the first turnup on the SPX 3 Week Chart since it turned down on the week of January 17.
That turndown occurred on trade below 4582.37.
So this may represent a “hidden pivot.”
At the same time, it is interesting that last week's recovery high closely to the low of the high bar week which is 4662.
In sum, the battle lines are drawn. It could be a sloppy resolution, so don’t get chopped up.
Be that as it may, we want to evaluate the behavior on a turn down of the WEEKLIES here.
That may come on the unfinished business of the SPX fully satisfying a kiss of 3501 (180 degrees down from the recovery high).
The likelihood of this presents itself given the SPX left a weekly “tail” last week. And remember that the weekly wheel of time takes precedence over the daily.
Breakage of 4500 that is sustained opens the door to lower levels: The 200 day ma is just below at 4485. So bulls will be watching that.
As well, there is a 50/20 day moving average Bowtie at 4400 region.
I will, as always, post the squares down below 4501 on the Hit & Run private Twitter feed.