In the movie The Usual Suspects, there is a villainous character by the name of Keyser Soze that strikes fear into the hearts of all who cross his path.
In the movie, Keyser Soze is not what he appears to be. He pretends to be what he is not… not unlike a vicious bear market rally.
As offered in Wednesday morning’s Hit & Run report, in “breaking out” above the February high, the SPX had turned its Monthly Swing Chart up. I went on to say that if the complexion of the market was truly bearish, the turn up in the monthlies would define a high soon in terms of both time and price.
In hindsight, it makes perfect sense that the bear market would stage a false breakout above the February highs, striking fear into the hearts of the bulls before faltering.
This is how Mr. Market rolls.
I coined the term Keyser Soze to describe a pattern where you get a Reversal of a Reversal… where something is not what the vast majority of market participants are expecting.
It is, in essence, a Reversal of a Reversal.
For example, let’s look at Thursday’s Keyser Soze sell signal.
The SPX broke out above the February high on Tuesday with a flourish… a gap up with a close near the high of the session's 56 point gain. It was too many bulls thinking, a reversal of the downtrend because the index had broken out above the early February double tops.
However, it was the blow-off, exhaustion of a bear market rally.
At least that’s what the weight of evidence indicates on Thursday night as I write.
On Thursday’s Hit & Run private Twitter feed, we warned that trade through Tuesday’s open gap would trigger a Jump the Creek sell signal. It came all at once in the last hour with the SPX knifing back down through the February highs of 4590-95… triggering the Keyer Soze sell signal in the process as well.
This is because the SPX reversed back down through Tuesday’s upside reversal.
The last hour slide exemplifies my trading maxim: fast moves come from false moves.
The false move was, apparently, the breakout above the well- defined resistance of the Feb highs.
While the SPX drove over two POTENTIAL time/price square-outs earlier this week, the 3rd one was a charm.
The third one was that the recovery high at 4637 vibrates off March 11.
Yes, the low was March 14, but that was a Monday and we must allow for + or – a day.
As well, remember the Mutual Fund Gamesmanship Strategy we walked through this week.
That may have been a factor in the SPX pushing through the first two square-outs like a knife through butter.
Be that as it may, the market saluted the 4637 square out with authority. Was it just the rug pull in the last hour at the hands of the mutual fund that likes to game their competition, or is the bear back?
Given the cluster of turning point dates into the end of March flagged in this space for the last two weeks, it clearly looks like the bear is growling.
There is more evidence to indicate we just saw an important high.
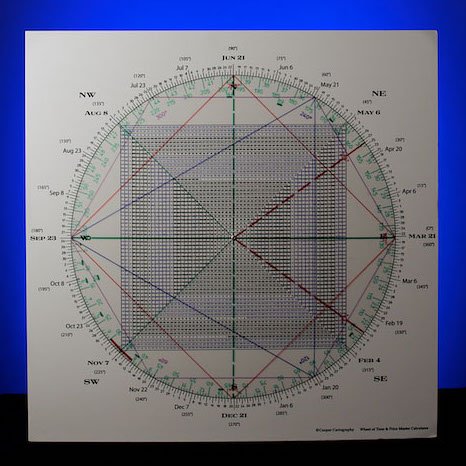
The rally off the March 14 low to this week's high was 475 points.
On the square of 9 wheel 475 precisely squares out with March 14.
Purple 475
Blue March 14
This is a square-out of RANGE with TIME.
In other words, the range of the rally points to the time the rally started.
This is another exhibit as to the way the Square of 9 Wheel reads the mind of the market.
There are several types of square-outs or balancing points:
Square-outs in price.
Square-outs in time.
Square-outs in time with price
and square-outs with the range of a move.
Markets are geometric and seek equilibrium.
When near-term trend moves too far against the context of the primary trend, the pendulum can and does swing the other way…
And often violently.
Those who have purchased a Square of 9 Wheel of Time & Price from me know the benefit of the Wheel is that it anticipates turning points allowing one to sell into strength and buy into weakness.
I have an old pamphlet of WD Gann’s that I found in an old bookstore 20 years ago where he wrote:
“Time and Price are one and the same. When they meet, expect a turn.”
In sum, 90 degrees down from the 4637 high is 4568.
When the SPX plowed through 4568 yesterday we saw accelerated momentum.
180 degrees down is 4501… a perfect hit of the 450 SPY strike for today’s Opex?
Following a large sell day an up opening pop is usually a sell setup.