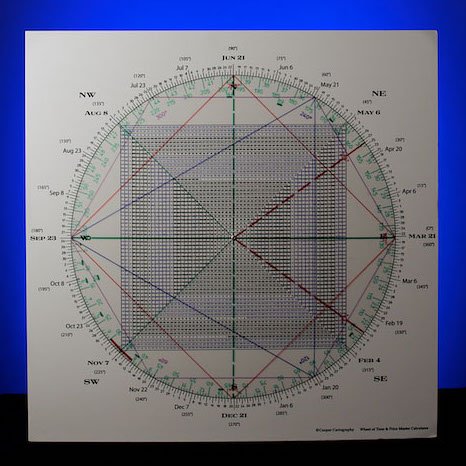
IWM was the lead index off the March 2020 low, advancing 143% from 95.69 to 234.53 on March 15, 2021.
As we know, 235 and March 15 is a Time/Price square-out on the Square of 9 Wheel.
As depicted below, 234 is 180 degrees straight across and opposite March 15.
Purple is 234, the March 2021 IWM high
Green is 96, the March 2020 low
They square each other.
Purple is 234 opposite March 15, red
IWM dropped to 208 in 8 trading days from its March 15 high.
As the sharpest decline since last September’s low, the move “overbalanced” the uptrend.
This is an important concept in Gann methodology.
It means that the trend is bending, if not already culminated.
It appears a countertrend rally in IWM ended this week as it tried to reclaim a 50/20 moving average Bowtie but faltered on Wednesday, closing back below its 50 day line.
If the leg down from the high (which over-balanced the prior up leg) was a Wave 1 down and the ensuing countertrend rally was a Wave 2, then IWM is on the brink of a powerful 3rd Wave decline that should take it below 205.
Allow me to explain.
90 degrees down from the 234.53 high is 219.50.
180 degrees down ties to 205.
IWM’s decline from its all-time high to 207 was just shy of 205.
The presumed Wave 2 rally Pinocchioed 219 resistance.
Yesterday’s pullback found support at 219 (219.94).
Breakage below 219 opens the door to the notion of a 3rd Wave down.
Here’s the takeaway.
If a 3rd Wave evolves, by definition, it will exceed the 207 low.
This means IWM will violate a 3 point trendline (red) from the September 24 lows.
Breakage of a 3 point trendline triggers a Rule of 4 Sell signal. This would be consistent with the idea of a powerful Wave 3 decline.
More importantly, downside momentum below 219 that projects to 205 will break the 209 Neckline of a Head & Shoulders topping pattern.
Breakage below 209 projects to 184. Interestingly, IWM’s 200 day moving average resides at the 180 region.
This ties to a full 360 degree decline off the 234 high, which is 177.
270 degrees down from the 234 ATH is 191.
This ties to 360 degrees up from the September 24 low of 142.
Got Geometry?
You can see how the Principle of Squares overlaps forwards and backwards through time like a chain link fence of price.
This morning we’re getting bouncage, but unless IWM can reclaim the presumed right shoulder, the writing is on the wall.
Sentiment fits.
Monday night, April 5, the S&P DSI (Daily Sentiment Index) amongst futures traders spiked to 90%.
This matches the highest extreme in over 7 months.
The last time the DSI jumped to 90% was August 26, just 5 days prior to the important September 2 high on the SPX.
The SPX dropped 11% over the next 15 trading days.
What’s interesting is that the September drop was a ripple from the 90 year cycle and the September 3 ATH in 1929.
Following the crash low in November 1929, the market rallied into April before rolling over.
While it may not be apparent by the indices, many stocks have crashed this year. Following Climax Runs, growth glamours like COUP and OKTA fell out of bed.
Momo names like JMIA, PLUG, NIO, XPEV, XONE, DDD have dropped 50% or more quickly.
Many hot IPO’s have imploded this year.
Names include AI, AFRM, DASH and POSH, to mention a few.
In sum, sentiment, intramarket divergences, and yesterday’s higher close in both the DJIA and SPX occurring with a negative Advance/Decline ratio indicate caution is warranted.
As well, yesterday the SPX left an NR 7 Volatility Contraction Day… the narrowest range in 7 days.
It was also the narrowest range day of 2021.
These contractions are oftentimes quickly followed by an expansion in volatility.
Additionally, there was more down volume than up volume, the slowest trading day of the year.
Despite the SPX spiking to a record high on Monday, trading volume has now contracted for 8 out of the last 9 days.
Contracting volume in tandem with expanding optimism coupled with the structure of the IWM suggest a downturn could come at any time.
The strongest sector, IWM, in the year since the March 2020 low may be on the cusp of a Wave 3 decline. Markets turn on a dime, most traders cannot.