

By: Jeff Cooper
Hit and Run Morning Report: May 19, 2023
Need help? Check out the Hit and Run Success Guide.
A New High for 2023, But….
“The Square and the Triangle form within the circle, but there is an inner circle and an inner square, as well as an outer square and an outer circle, which prove the fourth dimension in working out market movements.”
-W.D. Gann
Thursday saw markets push higher early in the session.
The SPX respected the key 4187 level and pulled back testing the Opening Range Breakout at 4160 ish and then squeezed higher relentlessly to 4202, a new high for 2023.
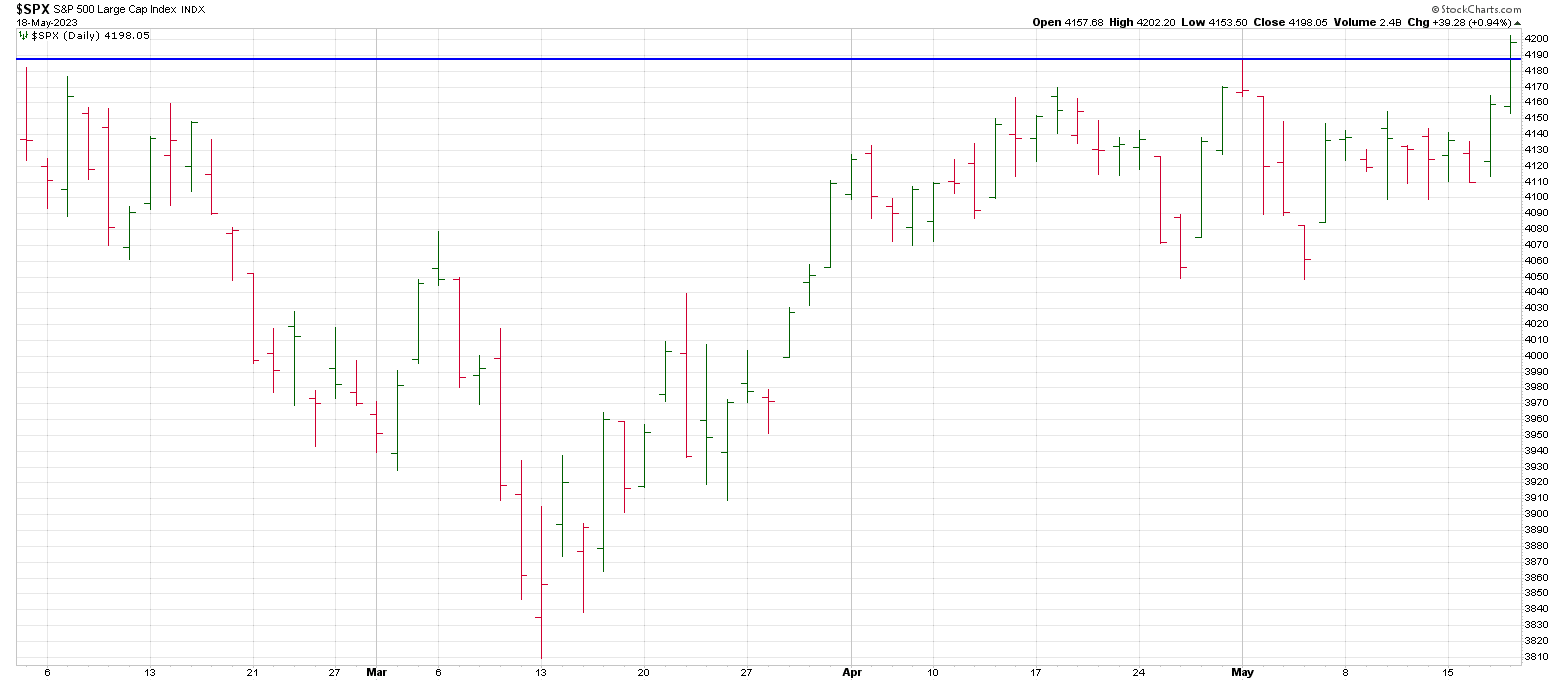
In so doing, the index shows a flat Rule of 4 Breakout.
So why the “but”…w hat’s the problem?
Firstly, not all breakouts are created equal.
They can be the most dangerous point… especially all-too obvious breakouts that have taken a long time to build.
Why?
Because often times breakouts are orchestrated in order to sell into by big money.
What it does is creates bids underneath by those looking for the prior momentum to be revisited.
Yes, breakouts often see backtests of the pivot, but these should be short-lived if the breakout is the real deal and the pullback should not probe too deeply into the “flat”.
Check out the weekly IWM below.
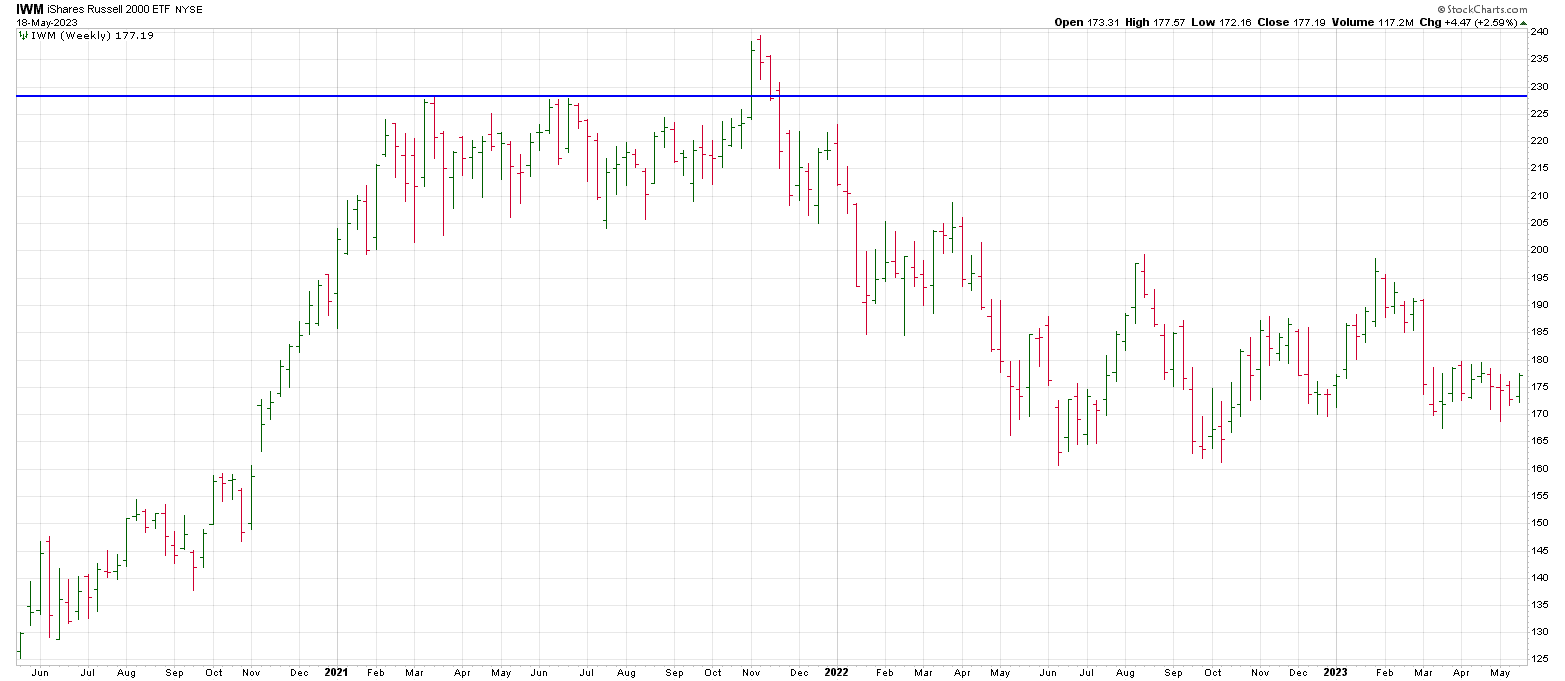
It broke out in early November 2021. It put in an all-time high the next week at 244 before dropping to 163 in June 2022.
Checking the monthlies gives an even more dramatic picture.

Not all breakouts are created equal sounds trite. It isn’t.
1) Thursday’s breakout fills the open gap from last August.
2) The advance from the October 2022 low now shows a possible “corrective” pattern of 3 Drives To A High.
3) Using the number grid on the Square of 9 as years versus price shows that 2023 squares out with 420/421 (4200/4210).

Voodoo Technicals?
What if I told you that the year 2009 squares out with March 6th… the bear market low of the Great Recession.

This is one of the factors enabling me to forecast March 6th, 2009 and 667 as the bottom of the bear.
You see 667 is opposite the year 2009 and square March 6th.

This same technique is going to be potentially very eventful this summer. Something I’ll flesh out in Monday’s report.
That said, a reversal back thru the prior high on May 1 will trigger a Soup Nazi sell signal.
This is a breakout to a new 20 day high that knifes back through the prior high within that 20 day lookback with at least a 4 day interval (to guard against continuation moves).
So essentially you have systematic buyers of new 20 day highs (monthly highs as there are 20 trading days in a month)but it’s “no soup for you” upon the reversal.
In summation, while we may have broken out we may be testing the key 4187 pivot which was our projection off the March low.
We have been using the week of May 17th as a turning point.
One factor being that May 17/19th vectors/vibrates off 481/482 (4818).

In summation, there is beaucoup synergy for a turning point this week which we have detailed in these reports for members throughout May. Above is the tip of the iceberg.
Going into today’s Opex reports show systematic positioning in equities remains very long.

It must be noted that these longs are not forced sellers unless the market drops hard. A trigger would be needed to shake them out.
But in that eventuality, they will have a lot to sell.
It is also worth noting that Bear Stears went belly up the same weekend in 2008 as SVB in 2023.
This is 15 years apart or ¼ or 90 degrees of Gann’s Master 60 Year Cycle.
The Bear Stearns news hit the market but it rallied after the initial panic.
That rally ended on May 19th, 2008.
After Bear Stearns, the first mouse got the squeeze, but the second mouse got the cheese after May 19th.
In a nutshell, we are in a blow-off in many individual names— NVDA, CRM, META as well as Hit and Run positons this week — ACLS and SMCI.
The blow-offs are in the face of TGT and HD tanking. This is no country for funnymentals.
Blow-offs don’t end by walking off the overbought condition by going sideways.
While there are many market watchers who think further point count can be found from squeezing shorts, it doesn’t appear there is anything to squeeze:
Current positioning for today’s OpEx in the SPY is:
In The Money Calls: 500,000 plus
In The Money Puts: less than 5,000
This could pressure stocks today triggering our Soup Nazi sell signal.
If Powell says something to that upsets the AAPL cart today, there is massive gamma to unwind.

