

By: Jeff Cooper
Hit and Run Morning Stock Report: May 2, 2023
Need help? Check out the Hit and Run Success Guide.
Editor’s Note: some readers did not receive this Morning Report on time so we are resending it here. We apologize for any inconvenience.
Powell And A Lizard On Deck
The FOMC meeting on May 3, 2023 happens 2 days before a lunar eclipse of the full moon in Scorpio.
The powerful impact of the Fed on financial markets is likely to be exalted and magnified this week.
At the same time, the US economy is on the precipice of recession, interest rates are high, inflation is high, and we have banking issues and bank bailouts in the context of the Fed having tightened their monetary policy faster than at any time in 40 years.
The lunar eclipse in Scorpio suggests the timing is ripe for further aggressive action from the Fed.
With the SPX rising to a high for 2023 that would seem to underpin the prospect for the Fed to lean toward a hawkish stance, adding the element of risk taking and surprise to the equation for Wednesday’s FOMC.
Moreover, with the seizure of First Republic Bank, look for mortgage rates to move up as much as 100 bp.
Succinctly everything about the macro and fundamental backdrop is negative, yet the market continues to move up… at least until Monday.
We are now inside the Fibonacci Cluster Window noted last week:
May 1, 2023 is 34 trading days from March 12, 2023 low.
May 3 is 55 t days from the February 14, 2023 top.
May 4 is 89 t days from the December 22, 2022 low.
May 4th is 144 t days from the Sept 30, 2022 low.
May 2 is 233 t days from the May 20, 2022 low.
May 10 is 377 t days from the November 8, 2021 top.
We have another unique development in addition to the synergistic square-outs mentioned in yesterday’s report.
The range of the bear market from the January 2022 ATH of 4818 to the October 2022 low of 3491 is 1327 SPX points.
Remarkably, 1327 squares May 17th, the anniversary of the start of the NYSE.
So what does that mean?
It is a square-out of the range indicating May 17trh is important, a likely turning point (+ or -).
Could the market continue to hold up/rally into mid-May?
Yes.
Could it drop into mid-May?
Yes.
If it drops hard into mid-May and stops and turns back up we have to watch it like a hawk.
Why?
In keeping with the Fibonacci extension from 1929 to 1987 giving 2023, it must be noted that in both 1929 and 1987 blow-off rallies started in May running approximately 90 days into the end of August (in the case of 1987) and early September (in the case of 1929).
From those two tops, October crashes came.
But for the here and now, The SPX slipped back after kissing our 4187 square.
To recap this is 540 degrees up from the December low.
The SPX left a Lizard sell signal. This is a new 10 day high that runs up and “tails” off leaving an open and close at/near session lows.
The reversal occurred from the backtest of a Ghost Line from the March lows.
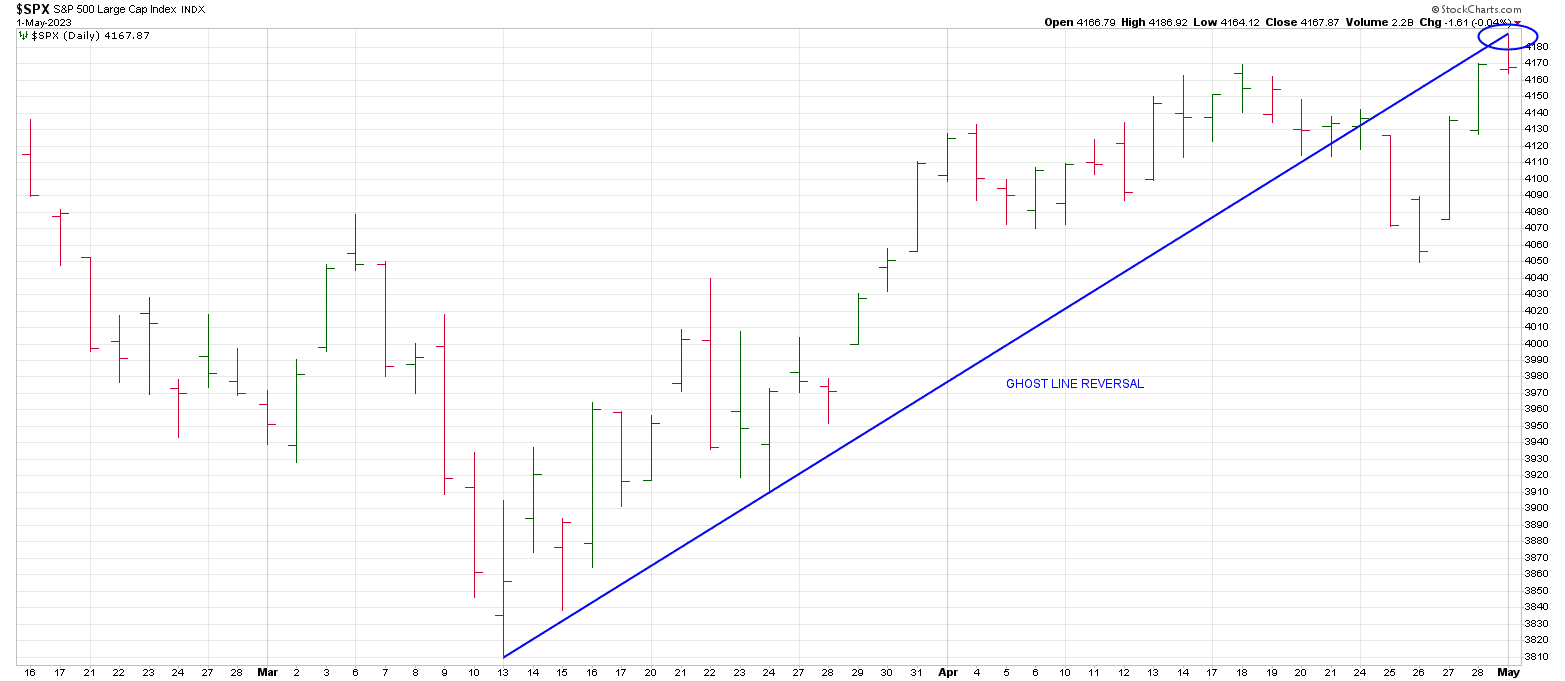
For the moment, this is a sign of indecision—not surprising in front of Powell.
Occurring after respecting the 4187 square on the nose and after turning the 3 Day Chart may be significant.
Or, it may mean it is simply respecting these two factors for the moment.
But we have a sell setup.
That said, setups are only setups. They must be triggered and then Follow Thru is key. (in this case that would mean downside Follow Thru).
Monday’s reversal came on other 2.2 billion shared day, tying for the slowest session of 2023.
The NY Summation Index also displayed another sign of indecision.
The McClellan Oscillator Index, closed below zero on Monday.
But, this was not the first crossing below zero in the last two weeks, or even the second. It was the third crossing.
Checking the downside crossings in December 2022 and February 2023 reveals that those two crossings below zero occurred within a week each time and that on the last crossing, markets accelerated shortly downward.

We will have to wait to see if the two day FOMC meeting acts as a catalyst that produces the beginning of a slide that many factors have signaled several different ways.