Is the SPX’ 50 Day Moving Average in Play?
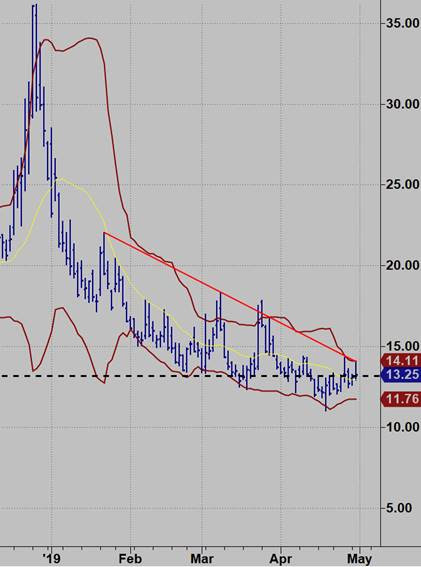
Well we didn’t have to wait long for the Volatility Explosion set up we warned of yesterday, depicted in a chart of the VIX, to trigger.
Indeed the market laid some boogie woogie on the king of the central banks on Wednesday.
May started with guns blazing on the heels of AAPL’s earnings spike, but it closed with a bang.
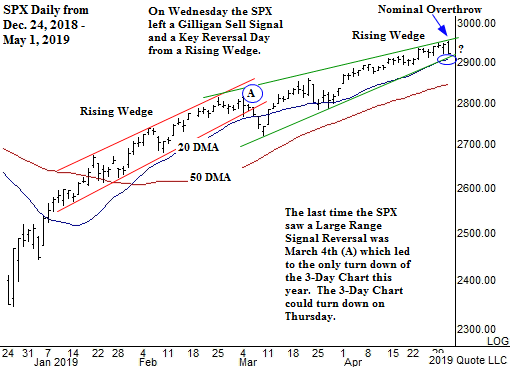
The SPX gapped up to a new all-time high and closed at the bottom of the day’s range, leaving a Gilligan sell signal.
This is a strategy I created to identify buying climaxes and exhaustion and at least a minor change in trend.
It is a gap up to a new 60 day high followed by a close at/near session lows.
The index also left a Key Reversal Day which is a new 52 week high with a close below the prior days low.
The last time the SPX saw a large range reversals such as Wednesday’s was March 4.
There is a distinction and a similarity between yesterday’s reversal and the one on March 4.
March 4 did not score a close near session lows. However, it did come from the top of a sharply Rising Wedge.
Notice that there was a little Gilligan sell signal on February 25. It was a narrow range signal, however.
Nevertheless, when that Feb 25 signal was tested on March 4, it perpetuated a sell-off.
The reversal from March 4th led to the first and only turn down of the 3 Day Chart this year.
As you know this occurs with 3 consecutive lower daily lows. When the trend is strongly up a turndown in the 3 Day Chart defines a low soon, in terms of both time and price.
Interestingly, the 3 Day Chart could turn down today. We have 2 consecutive lower daily lows on the table — albeit there was a detour with yesterday’s intervening new high.
So, the market stopped a little shy on the rally to an idealized square-out which could have occurred in the 2975 region and instead dropped down to a possible square-out. This is because May 2 conjuncts/aligns with 2920.
Just below this area is the 20 day moving average and a less steep Rising Wedge that that in March.
This is a more ominous looking Wedge because it reflects a loss of momentum.
So we have a clear setup to stalk. The 3 Day Chart could turn down on trade below Wednesday’s low today.
At the same time we could get a test of the 20 day m.a. and the bottom of a Rising Wedge near 2905.
If 2920 breaks we should see this 2905 region tested.
Because yesterday’s reversal came from a little Pinocchio of the top of the Rising Wedge, the probabilities are that this 2905ish region will be tested.
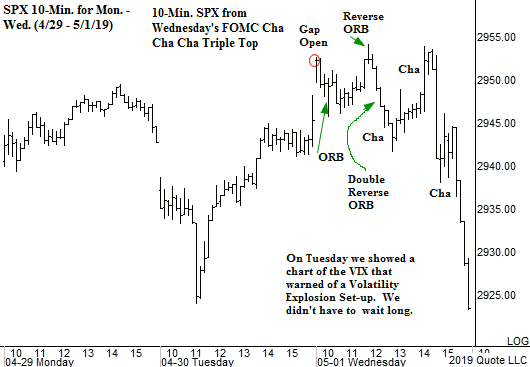
Drilling down to a 10 min SPX shows the tape was all over the place even prior to Powell’s presser.
The Fedspeak perpetuated a classic case of FOMC Cha Cha Cha.
The above chart shows there was a rare double Reverse ORB that carved out a little triple top at 2954.
Given Wednesday’s large-range reversal from the top of a Rising Wedge the indication is for lower prices.
90 degrees down from 2954 is 2900. This ties to the lower rail of the Rising Wedge and the 20 day m.a.
If that region snaps 180 degrees down from high is 2848. This ties to the 50 day moving average.
The SPX hasn’t been at its 50 day line since late January. Follow-through below 2900 suggests this is on the table.
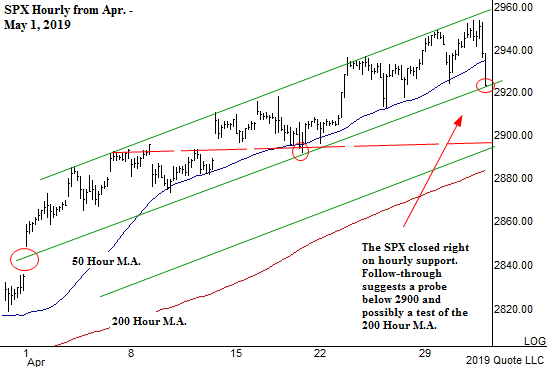
An hourly SPX further identifies the prospects for downside follow through.
The index is on the verge of violating short term support: the SPX closed right on a well-defined HOURLY trend channel
Note that a parallel channel ties to the key 2900-2905 level which dovetails with hourly lateral support..
So we have multiple support at 2900: it is 90 degrees down from high in addition to the aforesaid trendline support on the hourlies and dailies.
A break of 2900 should elicit a swift decline to the 50 day moving average.
Conclusion. Given the large range reversal from a Pinocchio above a Rising Wedge and the wicked reversals in many glamours, the odds are Mr. Market has 2900 in his cross hairs and probably a move to the 50 day line.
Earnings reversals in names like TWLO and TNDM underscore that the world seemed to be for sale on Wednesday.
(Related: How We Nailed TWLO)
It’s a good thing we sold our W long yesterday. It’s down 9 points pre-market, trapping many players.
It’s a good thing we sold our TWLO long on Wednesday’s open… grabbed after hours on Tuesday at 129.50.
SQ and CREE are two other names that are blowing up after reporting.
AAPL tailed off on huge volume, closing below a square-out level of 212.
The selling pressure across the board is underscored by declining volume swamping advancing volume by more than a 3 to 1 ratio.
Just as market made up in spades for the Santa Claus rally that never showed up last year, it may make up for ‘sell in May and go away’ that has been missing in action for the last 4 years.
Strategy. Up opens following large distribution days are not the stuff of upside reversals. Let’s see what happens if the 2900 region is tested.


