What the SPX Yearly Swing Chart Says Right Now
Going into the 4th quarter of 2021, we wrote that January would see the market get hit hard to kick off a bear market.
I think the worst first half in 50 years fits the bill.
One of the factors pointing to a fatal high in January 2022 was that it is 49 years from the false new high in January 1973.
As legendary market guru W D Gann wrote, “seven is the fatal number, the number of time.”
7 squared or 49 is the beginning of what Gann called the “Death Zone” or “Panic Zone.”
For example, both the 1987 and 1929 crash started roughly 49 calendar days from their highs those years.
January 2022 was a false new high just as was the false new high in January 1973.
Allow me to explain.
To identify major turns you want to key off the weekly swing charts.
The SPY left a Key Reversal Week on the week of November 22, 2021.
However, it bounced off its 20-day moving average to strike a new high into early January where it left a second Key Reversal Week.
The new high in January was a false high.

The second Key Reversal Week was the real deal: it led to an immediate turn down in the 3 Week Chart.
It was a classic case of the first mouse getting the squeeze (the first sell signal got squeezed) while the second mouse gets the cheese.
You always need to break support with momentum and then rally back to it to signal structural breakage.
The 3 Week Chart turndown in January snapped the 20-week AND 50-week moving averages and then rallied back to backtest the breakpoint in late March.
It must be said that the 50-week moving average had not been violated since being reclaimed in the advance from the March 2020 low.
While the SPY Pinocchioed its 50-week moving average to the topside on the rally into late March 2022, notably, that secondary high was defined by the fact that the 3 Week Chart turned up followed by a rollover.
The turn back up of the 3 Week Chart defined a high– consistent with the character of a bear market.
Immediately, the SPY 3 Week Chart turned back down off the late March high.
That turn down occurred on the week of April 18th with the SPY carving out an outside down week…more bearish technical indications and more bearish structural damage.
Following two consecutive higher weekly highs into the week of May 30th which set up my weekly Minus One/Plus Two sell pattern,
The SPY became a heat-seeking missile toward the inevitable– a turn down in the Yearly Swing Chart.
The last time the Yearly Swing Chart turned down was in the Covid Crash.
That was only a 4 to 5-week affair versus the first half’s saw-tooth slow-motion car crash.
The expectation when the big yearly wheel of time turns down is two-fold:
1) In the bullish context it defines an important low and signals new highs when 50% of the range from the prior high to the low is cleared. This is what occurred in 2020. Not only was a 50% retrace quickly satisfied but the Yearly Swing Chart turned back up when the yearlies turned back up in July 2020 on trade back above the 2019 high of 323.80. The reversal triggered a blow-off to 480 within 18 months.
2) Alternatively when the Yearly Swing Chart turns down within a bearish context, the presumption is for a knee-jerk rally over the next lower wheel of time…the monthlies.
Given the 6 month duration of this year's decline, which has OVERBALANCED in time any prior correction since the 2009 bottom, my expectation is that a knee-jerk rally play out on the monthly time-frame…ie, a summer rally.
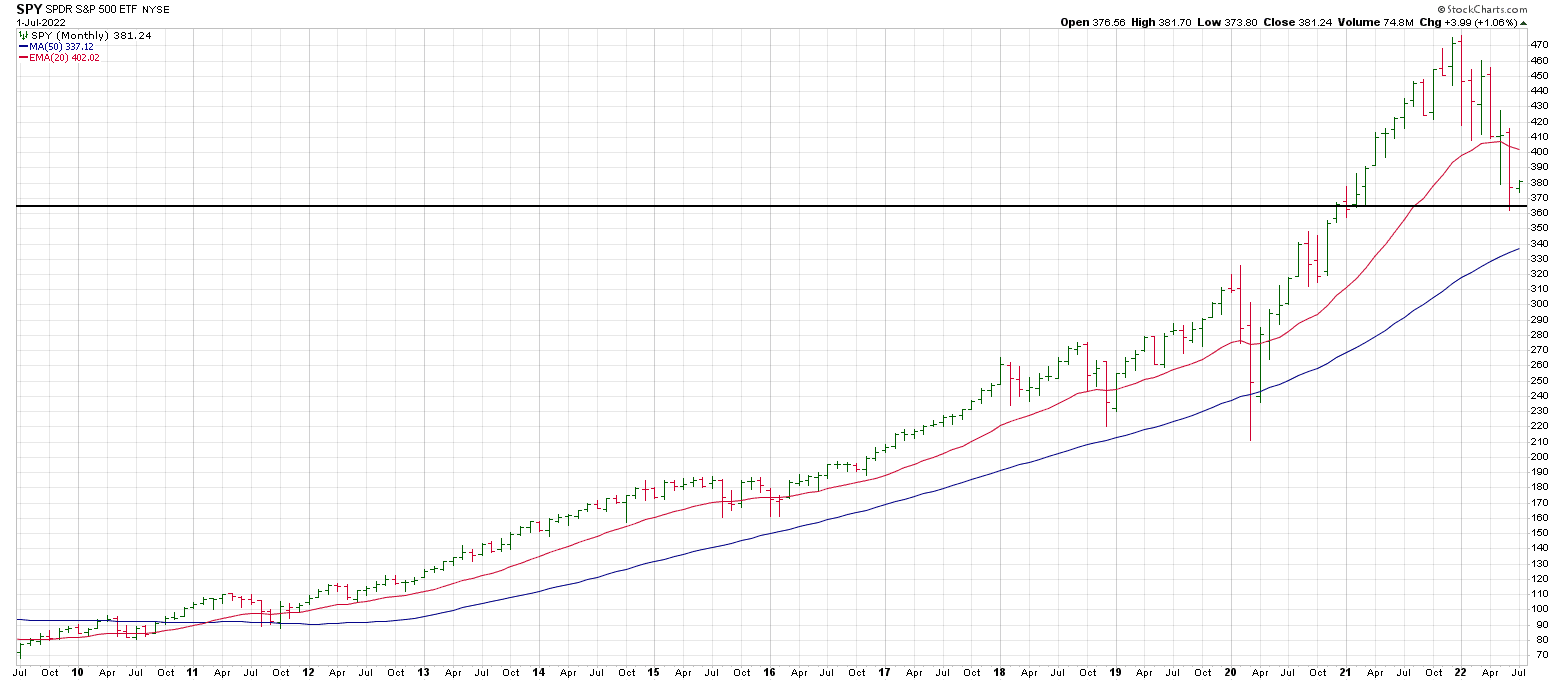
The horizontal black line indicates where the Yearly Swing Chart turned down
In the Hit & Run Morning Report for June 28th, we wrote, “…the NR 7 signal (on 6/27) may portend an expansion of range and volatility in both directions. We may get an Up Opening Reversal today after a push to the 3943 resistance flagged in this space yesterday.”
In fact, the SPX gapped up on Tuesday, June 28, setting a session high of 3944 in the first hour before rolling over to close 124 points lower at 3821…our initial Phil D Gap downside projection (from the up-gap on June 24th).
While the index slid below this key 3820 region on Thursday, it closed back above it at 3825 on the Friday weekly closing basis last week.
With a history of failed rallies in the first half, the question is will the bulls once again snatch defeat from the jaws of short-term victory?
99.999% of traders have never even seen the Square of 9... let alone understand its potential.
Do you dare to be different?
