This Is What Forced Liquidation Looks Like
One day after the market “cheered” The Fed, a one-two punch from stocks and bonds mauled financial markets on Thursday.
History shows when both get hit hard in tandem, it’s a rare bird that may indicate someone big is blowing up.
Wednesday’s late face-ripper rally on Powell’s non-Volker-ish comments that a 75 basis point rate hike wasn’t “actively” being considered seems like a construed gamma squeeze to “let someone out” in light of the intense selling from the get-go on Thursday.
A 10 min SPX shows yesterday’s Breakaway Gap followed by a Opening Range Break. And then breakage below Wednesday’s FOMC Cha Cha Breakout was a technical triple trifecta that sent the SPX reeling to close just a hair above 2022 lows.
This leaves the index vulnerable to satisfy a test today of our months' ago forecast of 4020.

Another session like Thursday’s does the trick.
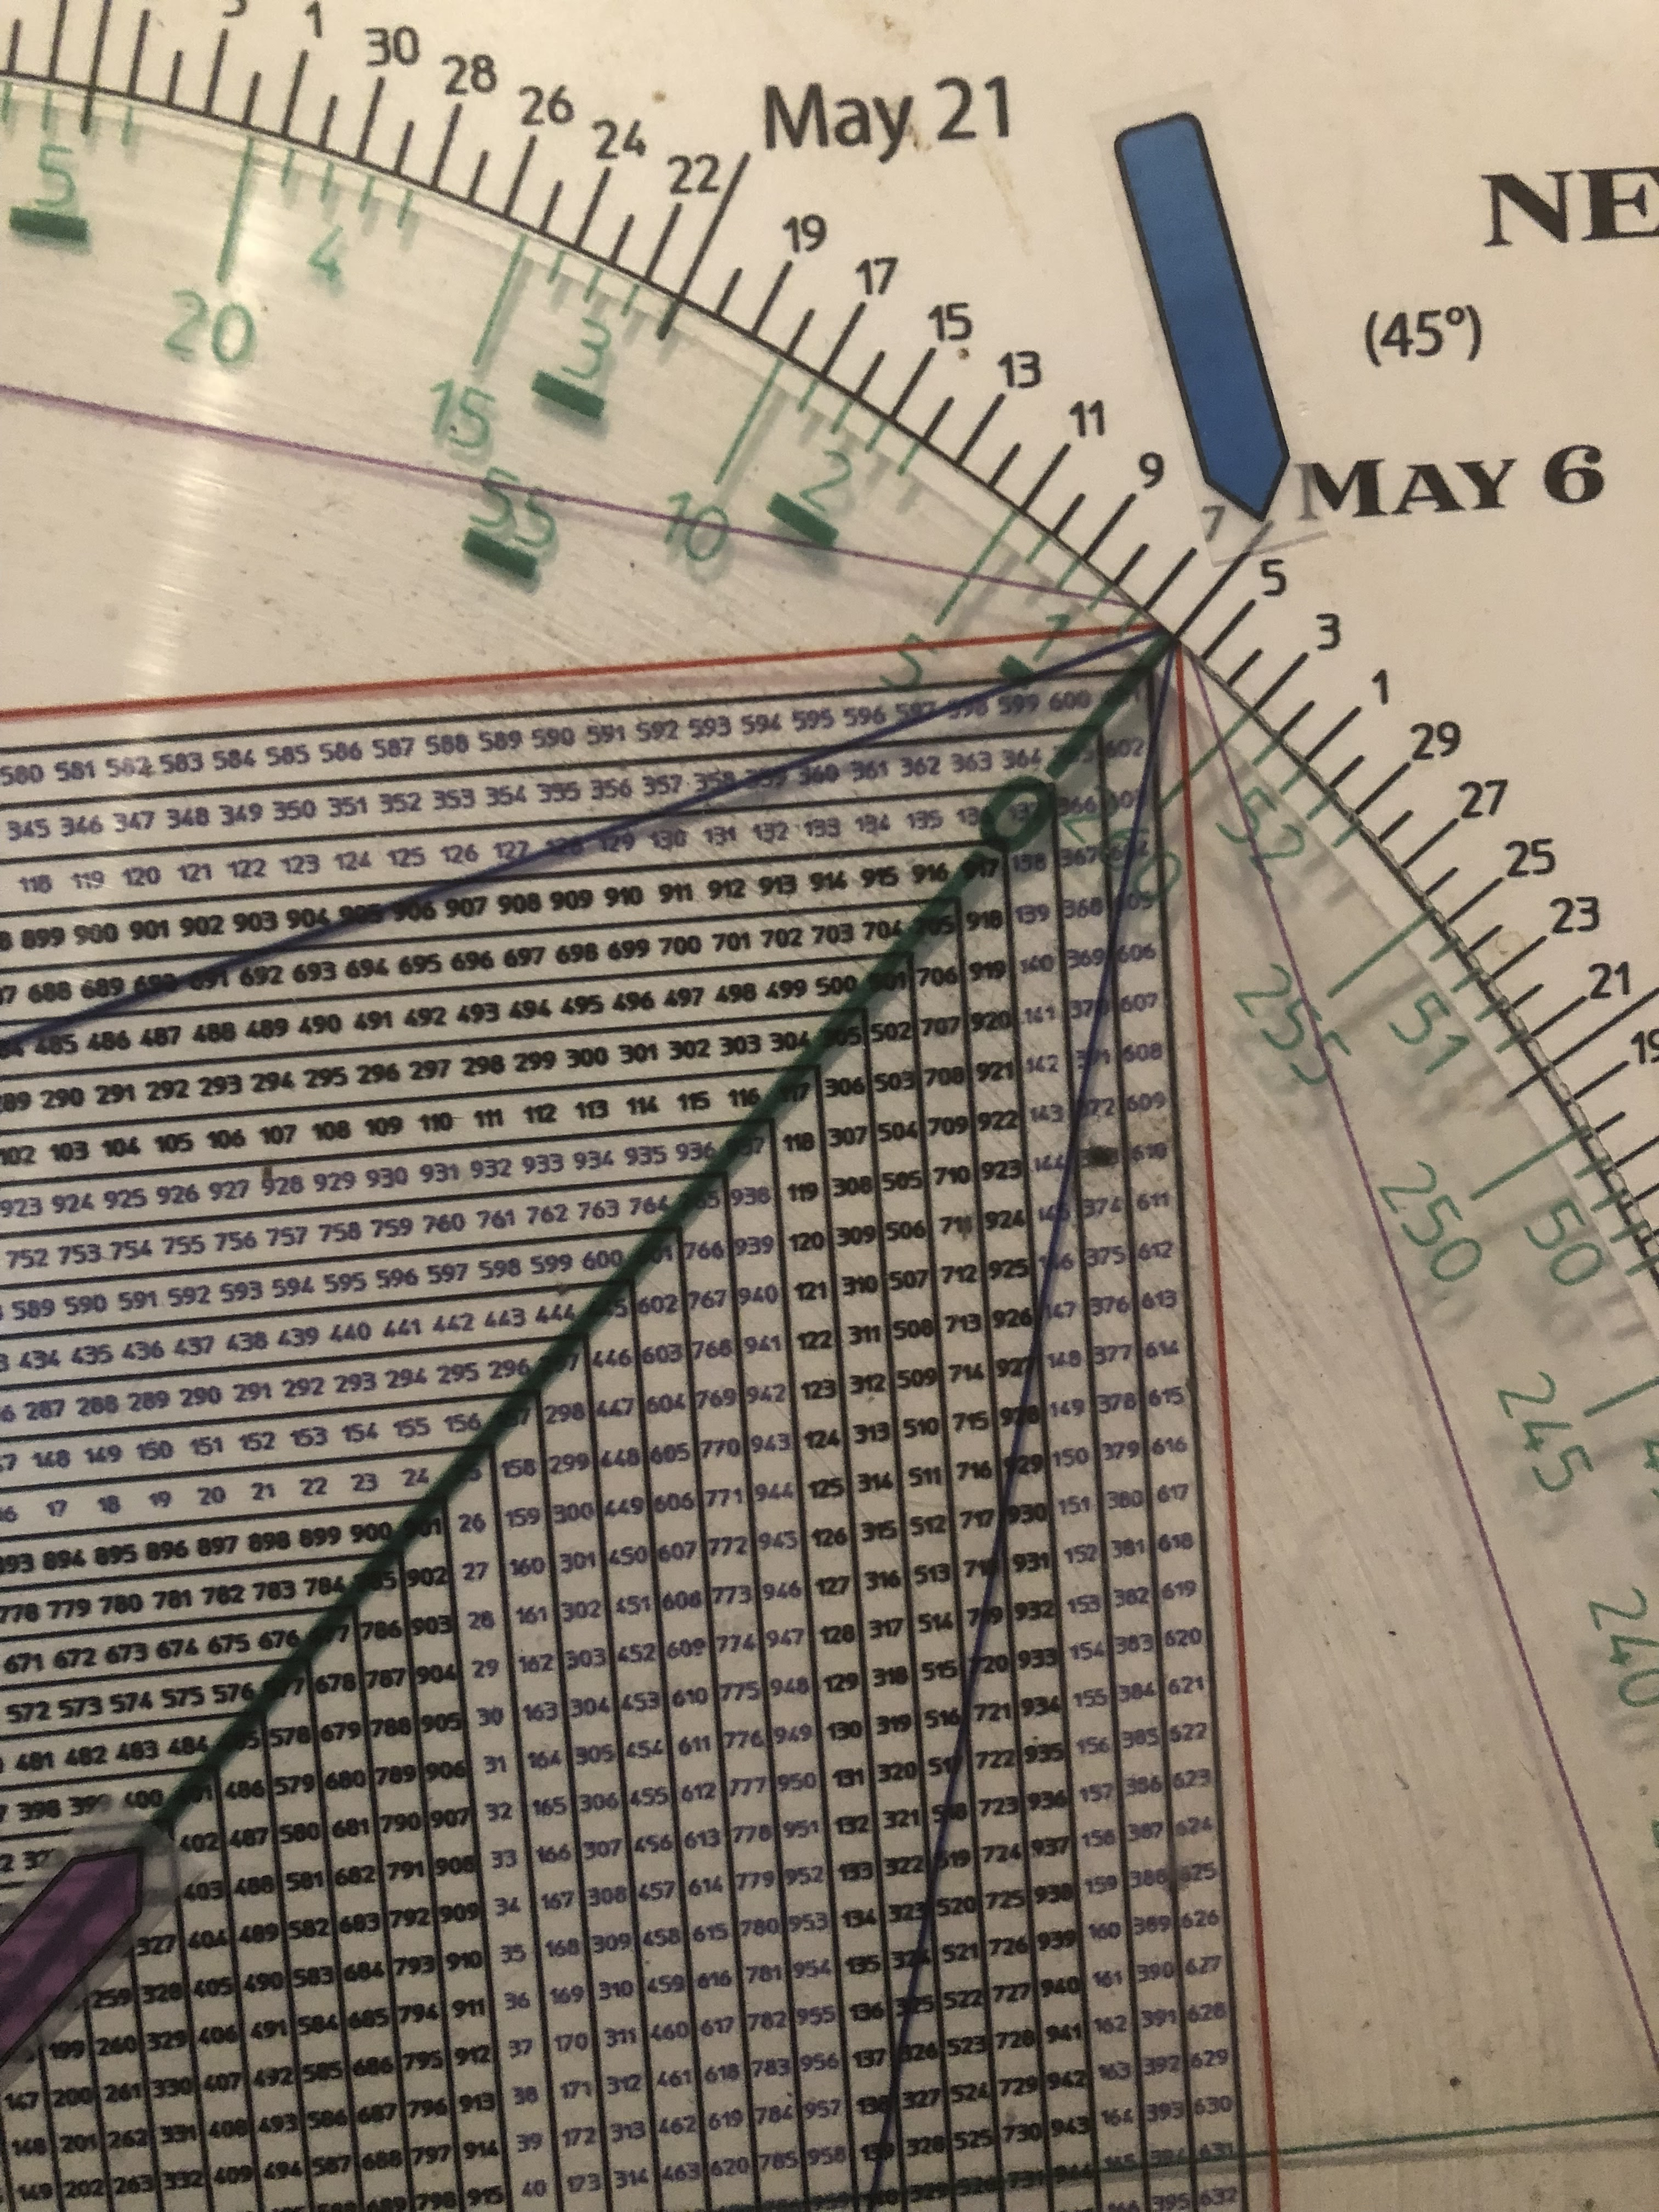
4020 is two cycles of an important geometric 540 degrees down from the 4818 ATH.
Interestingly Time & Price “meet” at 401 (4010) on May 6 on my Square of 9 Time/Price Calculator.
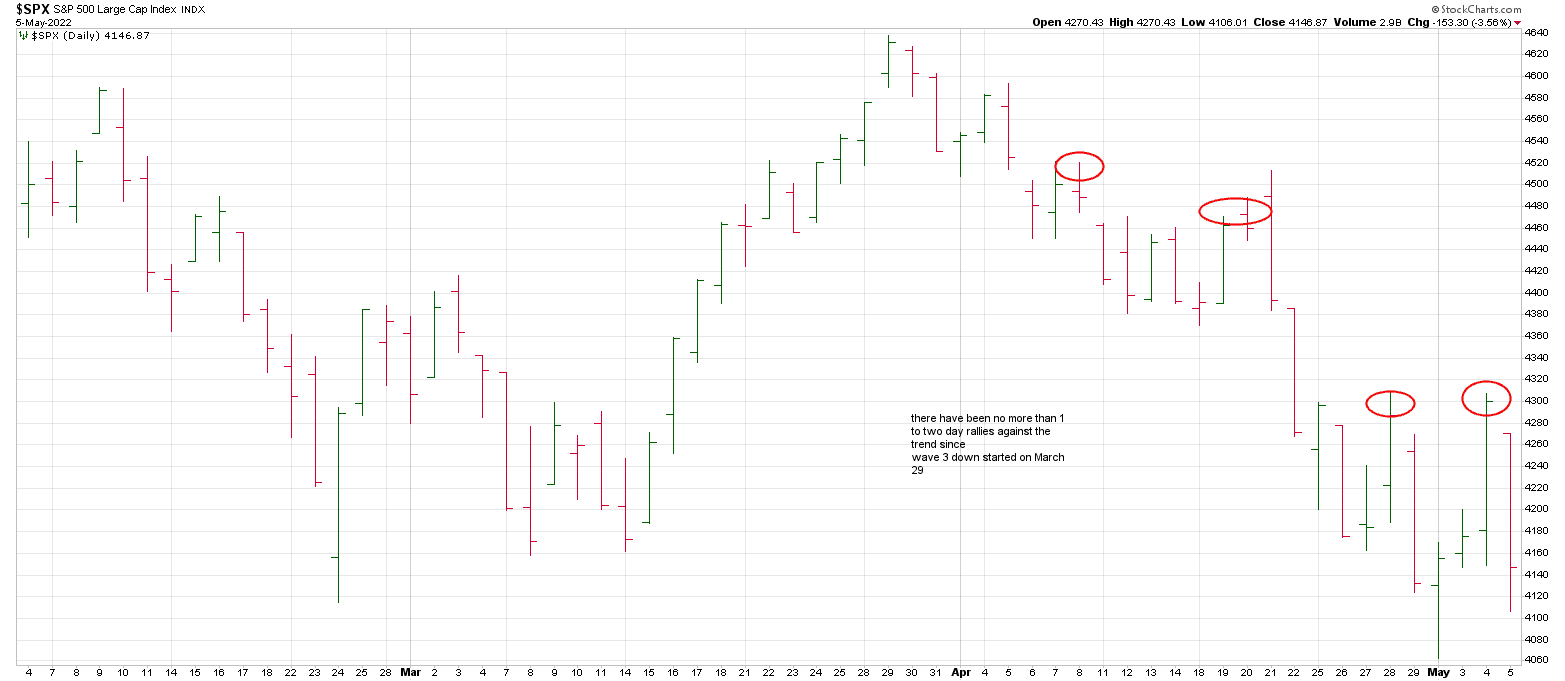
A weekly SPX below shows a trend channel with the bottom rail at the 4020 region.
Notice that a rising Ghost Line from 2020 defines the Wave 2 corrective high on March 29.

Since the late March high the SPX has been in a powerful Wave 3 decline.
Thursday’s plumb-line drop is consistent with wave 3 of 3 accelerated momentum.
Consequently, the presumption is going into the weekend has a strong shot of seeing 4000 region struck — especially is someone is blowing up. The counterparties will demand the piper be paid before the weekend.
In sum, it would not be surprising to see a sequel today to Thursday’s blood on the street.
The decline today, all year has been orderly. Even yesterday was orderly.
It may take breakage below the above weekly Trend Channel to get the Passive Crowd to throw the towel in.
Checking the leading semiconductor ETF, SMH shows that 221 is a key 540 degrees down from the 319 high.
221 on SMH ties nicely to a drop to 401 SPY (4020 ish cash).
So there is some good synchronicity pointing to the idea that we may be close to interim capitulation.
Eerily, the 319 SMH ATH squares out with September 3, the DJIA peak in 1929.
That said, as stressed to subscribers in recent weeks, cycles exert their downside influence into mid to late May.
And, time is more important than price.
So regardless of what happens on a direct hit to our idealized 4020 target.
That said technical support is a bull market concept.
Support is made to be mauled in a bear market.
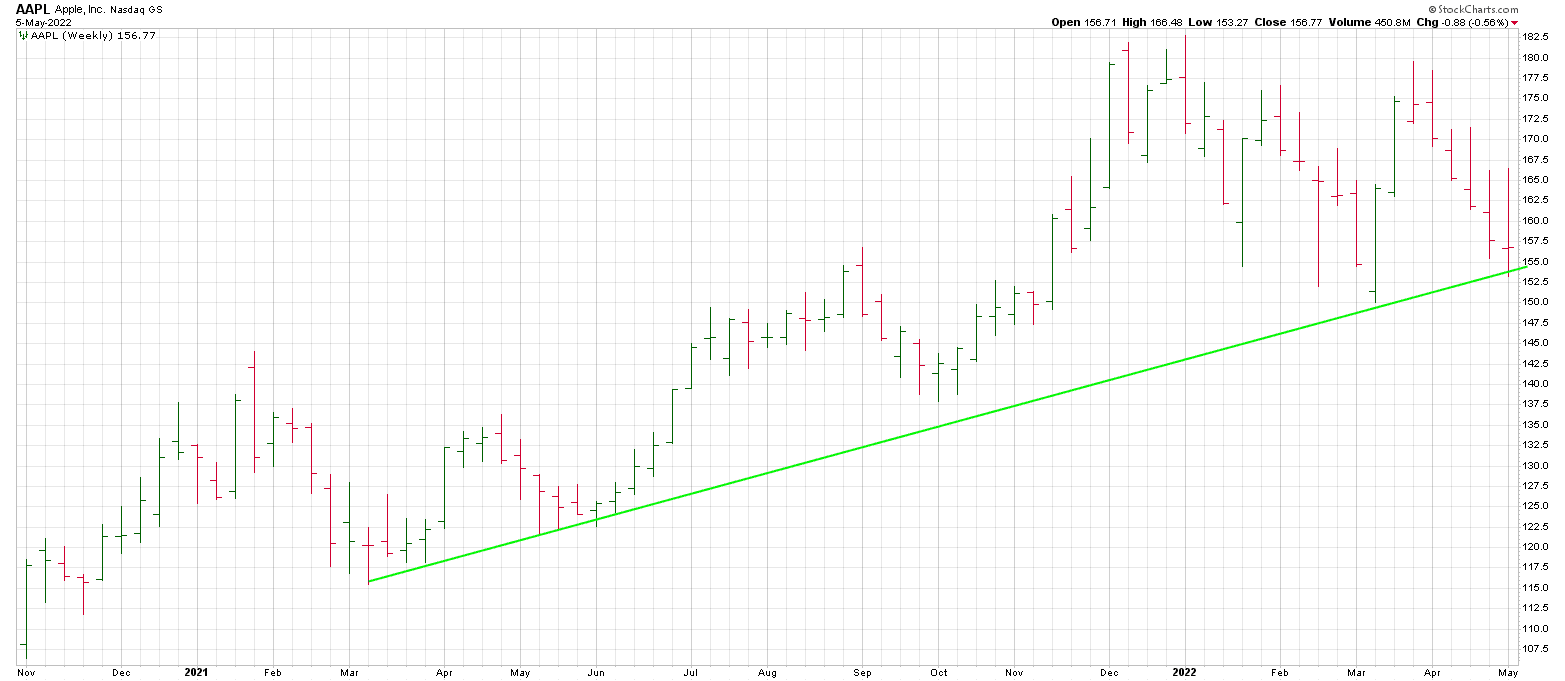
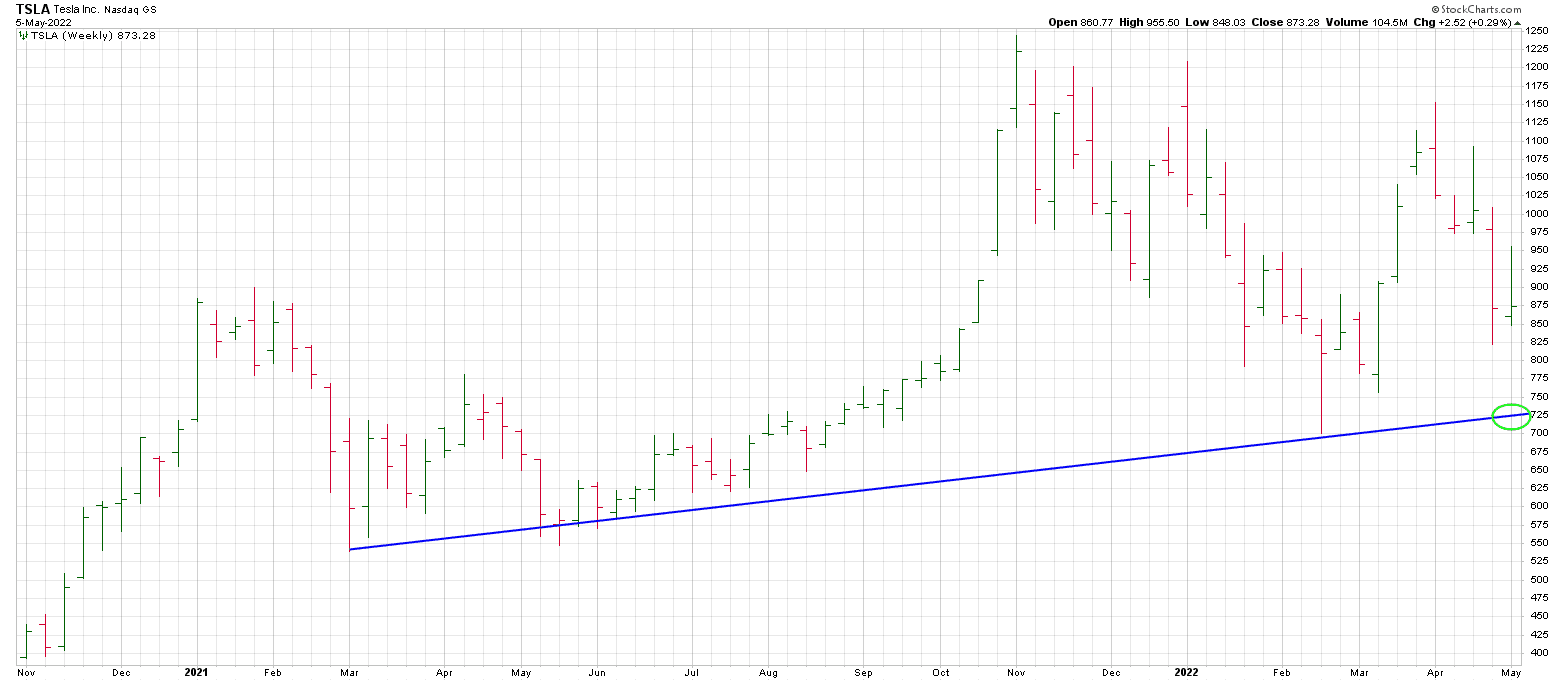
Be that as it may, two key stocks, AAPL and TSLA are flirting with key support.
AAPL bounced off the 154/155 weekly trend line support on Thursday.
Breakage below this region prolly telegraphs a bloody Friday.
As well, TSLA looks like a heat-seeking missile to weekly trend line support at the 745 region
The Gann Great 90 Year Cycle points down into late June.
The Gann Master 60 Year Cycle points down through May.
WD Gann stressed the importance of anniversary dates.
May 17 is the anniversary of the 1792 Buttonwood Agreement that was the birth of the NYSE.
This also ties to the Gann Panic Zone counting from the March 29 recovery high.
While Friday looks like a big day that may finally trigger some genuine fear with a whoosh lower in the coming hours, sustained breakage below 4000 opens a Trap Door to the 3500 region in weeks ahead.
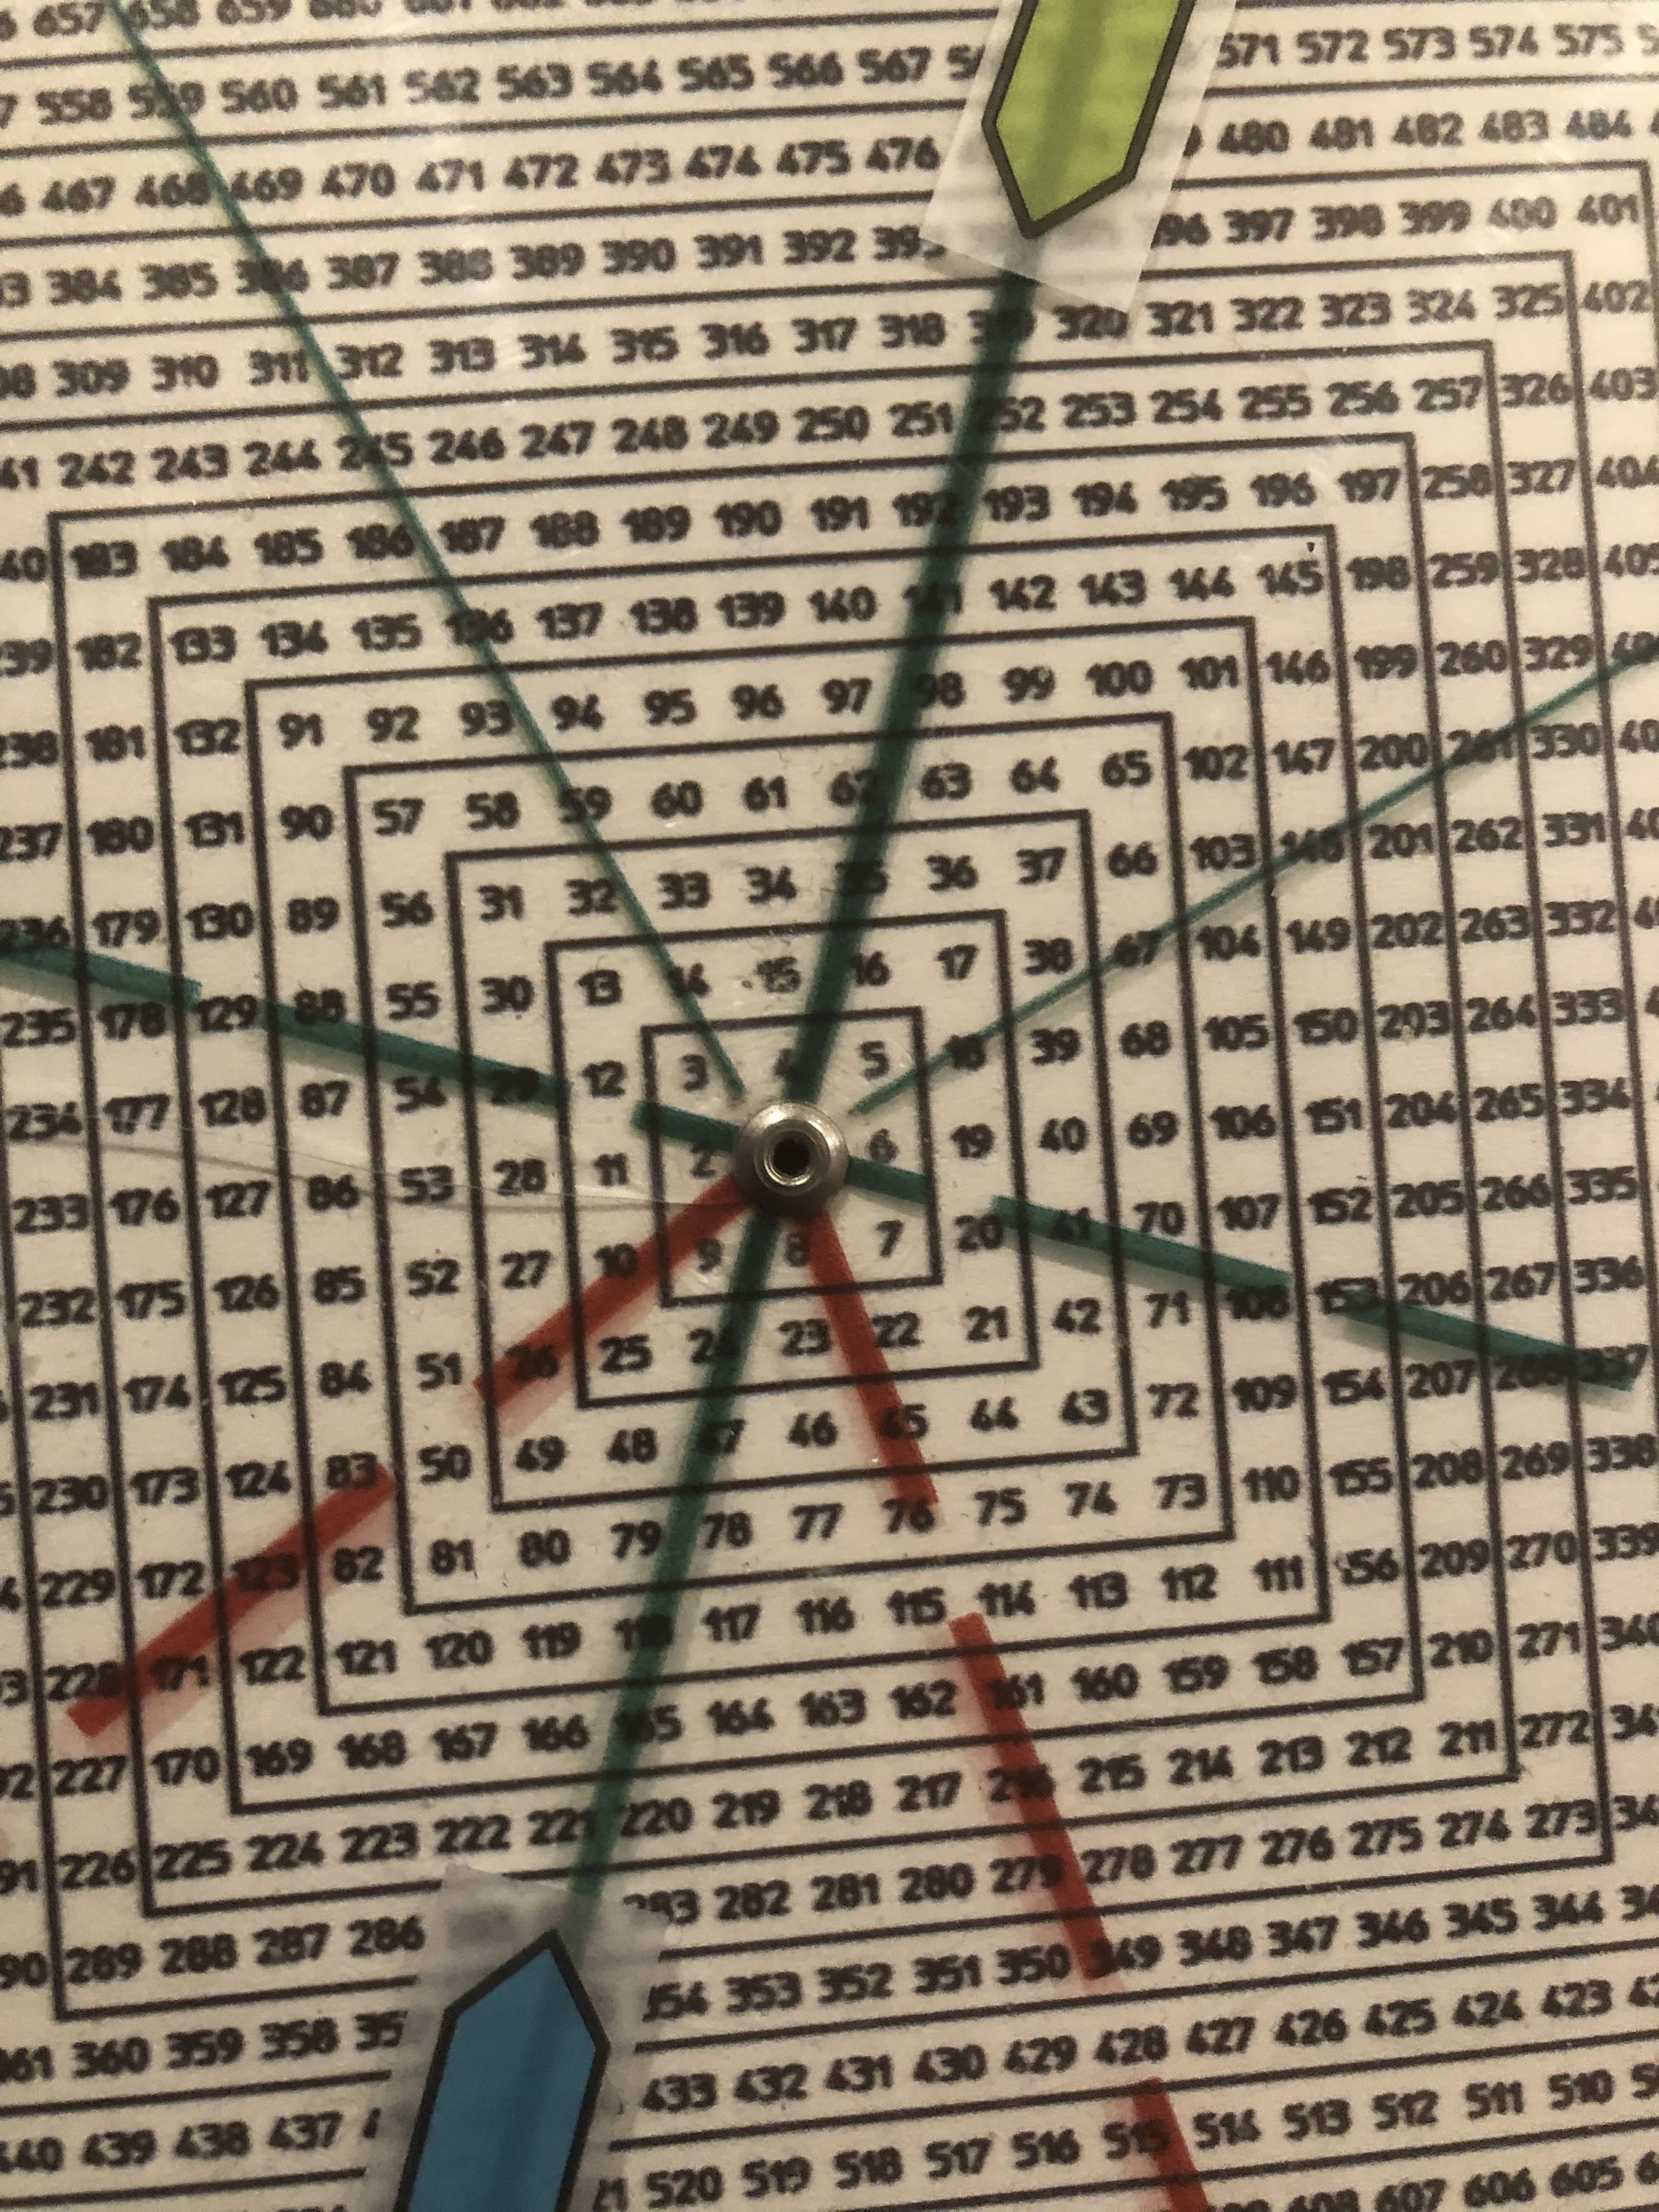
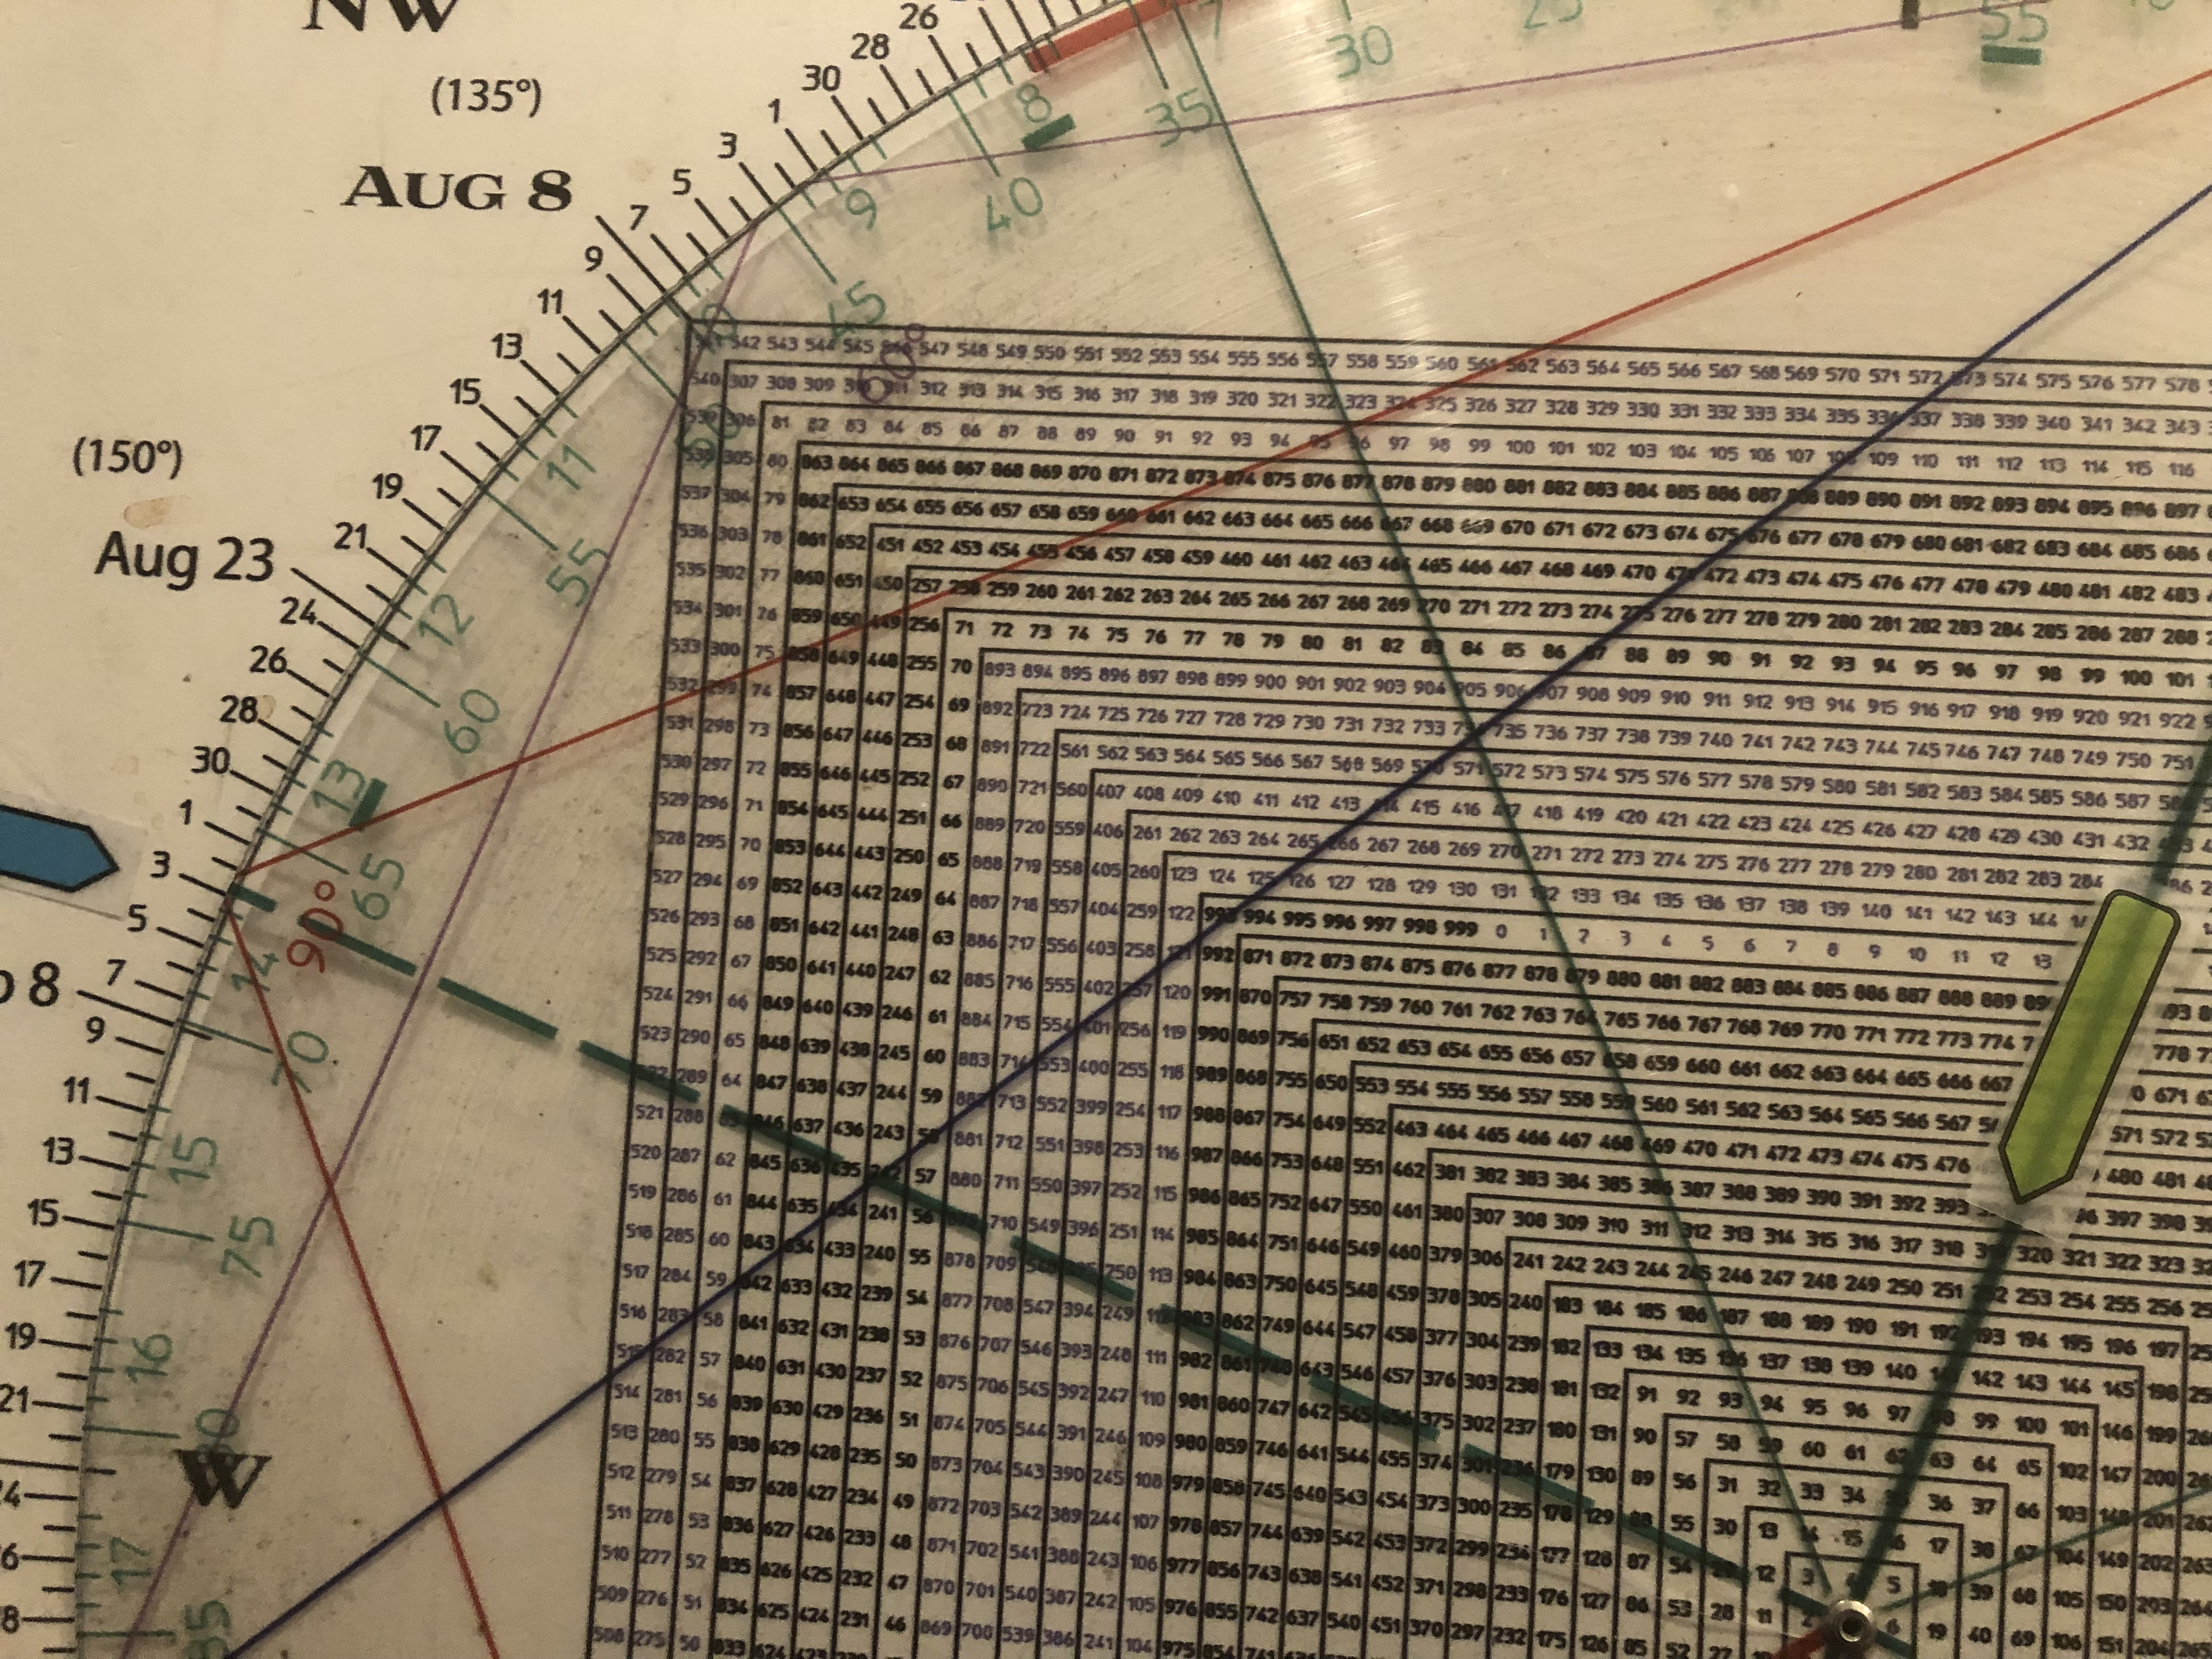
99.999% of traders have never even seen the Square of 9... let alone understand its potential.
Do you dare to be different?
