The Crash of 2022
- January 24, 2022
- / By Jeff Cooper
Throughout the last quarter of 2021, the Hit & Run Report outlined how stock indexes were expected to see a series of peaks, first in late November, then no later than early January 2022.
There were several reasons for my outlook:
1) The SPY March 2020 low was 218.
Three full price cycles of 360 degrees + 180 degrees up from 218 is 474 .
This is a total of 1260 degrees, the Biblical Time (360), Times (720) and half time (180).
Price equaling Time.

Green 218
Red 474
The SPY struck an all-time high at 474 on November 22, 2021 leaving a Key Reversal Day, and declined sharply to 449.
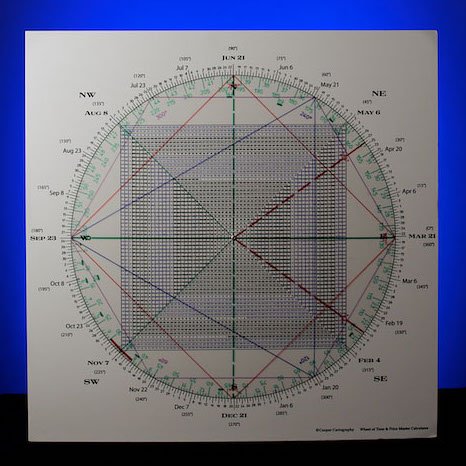
2) At the same time, November 22 is an important pre-crash peak vibration.
Why? Because November 22 is square August 24, the 1987 pre-crash high, and it is square February 19, the 2020 pre-crash high.

Nov 22 red
Aug 24 blue
Feb 19 green
Mr. Market has a memory.
The presumption was that a last ditch high could occur into early January 2022 as it is 49 years (7 squared years) from the false breakout high in January 1973 that marked a peak prior to a devastating 2 year bear market.
Our forecast was the flat-top breakout in The Truth Teller, IWM, in early November was a false breakout akin to January 1973.
From its high on November 8, IWM is down 19%.
Seven is a number used throughout WD Gann’s coded novel, The Tunnel Thru the Air.
Let’s take a peek. Gann was born in 1878. The protagonist in the novel, Robert, was born in 1906.
These are 18 years apart, or 4 X 7 years.
The time from Gann’s birth in 1878 to the year he published the book in 1927 is 49 years (7 X 7 years).
The difference between 1906 and 1927 is 21 years, or 7 X 3 years.
Be that as it may, Gann referred to “7” as the number of time and the fatal number.
His methodology also keyed off what he called the Law of Vibration.
Vibration is caused by two factors resonating with each other — such as the square of two numbers.
For example, 7 X 7.
7 X 7 was the beginning of Gann’s Panic Zone. 7 Weeks or 49 days.
The end of the Panic Zone came on the 56th calendar day or the 8 weeks from a high.
This defined the great crashes in both 1929 and 1987.
The beginning of the panic selling started around the 49th day from high and ended around the 56th day from the ATH.
The early January highs in 2022 on the SPY and SPX were divergent highs, short-lived and unconfirmed by other indexes.
49 days from the key November 22 peak is January 10.
56 days ties to January 17. Gann also said to always key off the weekly charts.
We clearly crashed into this time frame.
The question is whether we are staring a rally of some degree in the face.
The SPY/SPX closed below their 200 day moving averages on Friday for the first time since February 27, 2020.
That was the eye of the hurricane which had another month of spiraling lower.
In 1987, on Friday, October 16, the SPX closed decisively below its 200 day for the first time off the high and crashed on Monday, October 19.

Last Friday, the SPX closed below its 200 day for the first time off the high.
Although the Gann Panic Zone has closed by the book, the market is not a fine Swiss watch.
It warrants giving the market leeway of a day or so within any cycle.
As well, from the ATH SPY high of 480 on the Square of 9 Wheel, 180 degrees down is 437. Friday’s low (and close) was 437.95.

480 red
437 green
So the SPY has reached an important region at an important time frame… potentially.
For its part, at 4410 the SPX has declined an important 540 degrees from its 4818 ATH.
Readers know the significance of 540 degrees being a true square… a cube.
Interestingly, the 4818 ATH hit just 80 points shy of my idealized theoretical high of 4900 (70 squared).
In other words, the SPX was just shy of 70 squared in price 7 squared years from the major January 1973 high.
2022 is a crash year.
We have already seen a vast number of glamours crash.
The real question is, is this a major bear market collapse like 1929 or 1973 or is it more in keeping with 1987?
If it is a 1987 style downdraft, today will be pivotal.
We haven’t seen many Friday/Monday crashes since October 1987.
The Friday before the ’87 crash the SPX closed below its 200 day moving average –just like last Friday.
However as offered above, the Gann Panic Zone points to Friday as a potential selling climax.
That does not mean the market may see a significant bottom.
We could see a trading bottom with a multi-day or multi-week bounce before lower.
As well, while March projects weakness, markets could remain vulnerable into June/July… 180 degrees from the early Jan ATH.
IF the market is going to whoosh lower today, we should know from the getgo.
We should be hard down in the first hour… if not pre-market.
If this is not the beginning of a bear market, the SPX could still see pressure into March in the context of a 1987 style panic.
One reason being the closing low of the 1987 crash occurred in December, 4 months from the August ATH that year.
4 months from the November orthodox high gives March 2022 as a period to watch.
In sum, December was an outside up month. January struck a new high in the SPX and traded below December’s 4495 low, setting an outside down month.
We have a MONTHLY Reversal of a Reversal, or what I call a Keyer Soze.
In other words, December was an upside reversal while January has seen a downside reversal.
The Keyser is a diabolical signal which warrants caution — especially as this is on the monthly basis.
Conclusion. Today is a big day. The first time the SPX 200 day is tested/undercut usually (not always) sees a good low or at least a rebound/relief rally.
Last week was the worst week since March 2020. On February 27, 2020, the SPX closed below its 200 day ma for the first time in a while and the next session went somewhat lower before reversing to the top side. That reversal perpetuated a rally that reclaimed the 200 day for 2 to 3 days.
Then all hell broke loose.
If the current test/undercut of the 200 day does produce the usual low or a least a relief rally, then the unusual, a whoosh, is in the cards.
99.999% of traders have never even seen the Square of 9... let alone understand its potential.
Do you dare to be different?

Popular posts
99.999% of traders have never even seen the Square of 9... let alone understand its potential.
Do you dare to be different?