“Before you hit the jackpot, you have to put a coin in the machine.” – Flip Wilson
With astonishing consistency, stocks tend to demonstrate predictable price patterns that adhere to the Principle of Squares.
The Principle of Squares is the conceptually correct concept that price progression unfolds in a logarithmic or square root sequence versus a linear form.
Price when coupled with the Time Factor as trading seer W D Gann called it, squares-out or balances out at important turning points.
Gann wrote that every major high or low is a square-out in time and price.
What he did not say is that not every square-out is a major high or low.
Square-outs are more art than science.
Allow me to explain. Sometimes a Time Price square-out will occur at a precise high or low.
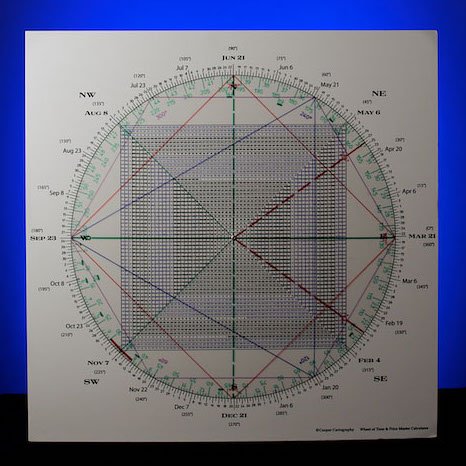
For example, the March 6, 2009 low was a square-out with the price of 666/667 SPX.
667 being square March 6.
March 6 blue
666/667 purple
In other cases, the date of an important low will point or vibrate to a high.
For example, QQQ struck an important low last October 4.
The ATH in 2021 was 408.71 (409 rounding).
Oct 4 is 180 degrees straight across and opposite 409.
Oct 4 purple
409 red
Time pointing to price, price pointing to time: a time/price square-out.
It pays to measure from intraday highs and closing highs — especially when there is a big discrepancy such as the late Nov ATH.
The closing ATH is 404.
90 degrees down from 404 is 384.
The Q’s show a Friday weekly closing low below that at 379.86.
The takeaway is that the downside door is open to at least a 180 degree decline, which is 364.60.
This ties to the 200 day moving average, which is currently at 363.36 and moving up.
Checking a weekly QQQ shows the bottom rail of a trend channel from the March 2020 crash low around 320.
Above that is a trendline/smaller channel that also ties to 363.
IF QQQ can bounce, the ideal shorting level is a Bowtie of its 50/20 Bowtie near 392/393.
That means it probably won’t get there.
Be that as it may, we want to watch for any bounce where the dailies turn up, i.e., trade above a prior day's high.
In fast moves, often that is all you get… 1 to 2 days against the prevailing strong trend.
In sum, the weakest link is the Q’s, which have been a mirror image of TNX, which has a triple top or Rule of 4 Breakout on its weeklies.
The Q’s should follow suit on the downside with a Rule of 4 sell on its dailies –breakage of the triple bottom at 379.
That opens the door to a drop to 363 — probably quickly.
Tomorrow's report will take a look at the Principle of Squares and the implications of the patterns from 1929 and the message of the Monthly Swing Chart.