The Message Of the Market
- January 4, 2022
- / By Jeff Cooper
The 3 Day Chart turns up with 3 consecutive higher daily highs. This is intraday highs, not closes.
The 3 Week Chart turns up with 3 consecutive higher weekly highs. This is intra-week highs, not closes.
The opposite is true for turndowns in each.
The 3 Day Chart and the 3 Week Chart do a good job of determining and defining the near term and the intermediate term trend.
The turn up or turn down of either is not in and of itself a bullish or bearish tell; rather, it is the behavior following the turn up or turn down.
The SPY 3 Day Chart turned down on Friday with 3 consecutive lower lows.

When the trend is strongly up, as it has been in the SPY, the expectation is for it to define at least a short term low.
It did on Monday morning.
Although it was not pretty: the SPY spiked higher, only to completely reverse red before mounting another push higher, carving out an outside up day.
So we have a higher high. Trade above Monday’s high today will give 2 consecutive higher highs.
Since the 3 Day chart is pointing down, which satisfies the – 1 part of the method, if the SPY exceeds Monday’s high, it will then satisfy the +2 part of the method.
So today the SPY could easily go into the Minus One/Plus Two sell position.
This is not an automatic invitation to sell.
It means this is when we can take the temperature of the market.
We do so by watching the ensuing behavior once it “assumes the position.”
Interestingly, Friday was the first time the SPX turned its 3 Day Chart down since October 1.
If you check, you will see that that was NOT 3 consecutive lower daily lows; however, the SPY traded below a ringed or circled 3 Day Chart low from the prior month and this also turns the 3 Day Chart down.
Arguably, one could say that the double bottom on the SPY in December was telegraphed by the fact that the 3 Day Chart remained up throughout December’s volatility.
Indeed, that double bottom, in hindsight, perpetuated the recent breakout to new ATH’s.
Indeed, on Monday, the SPY checkbacked to backtest the key 473-474 region.
Why is that key? Because it was the November 22 high… the high of a Key Reversal Day which unleashed a 23 point SPY drop in short order.
Strictly going by the pattern — Monday’s outside up day that “seems” to have successfully backtested the November peak (prior resistance turning into new support?) looks constructive.
However, Thursday was an outside down day, with a Minus Two/Plus One sell SETUP on deck.
Moreover, remember that Thursday’s ATH on the SPX was precisely 360 degrees up from the December low.
My take, is IF the SPX clears and sustains above Thursday’s high — triggering a Keyser Soze buy setup (a Reversal of a Reversal in the process) and this 360 degree region up from the Dec low, then theoretically a fast move could play out.
Perhaps this could be the final fling that takes us to my projected potential 4900 cash in coming days.
Alternatively, if the SPY reverses down dropping below Monday’s low, it triggers a Keyser Soze sell setup.
This would occur on breakage below the 473.50 (4740 cash) region.
Importantly, this is the pivot where we got the triple top breakout or Rule of 4 Breakout last month.
Conclusion. If we get a final fling, it may be synchronous with the 49th (7 squared) anniversary of the January 11, 1973 top. This was the top prior to the largest downturn since The Great Depression.
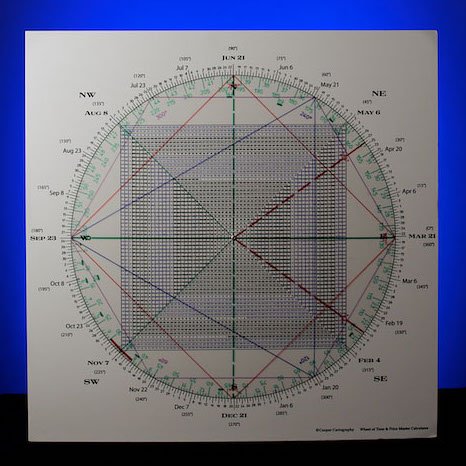
It is interesting that the DJIA ATH in 1929 was 386 and that 386 is 180 degrees straight across and opposite this mid-January region.

386, red
Mid January, blue
It is more than a little eerie that the 1929 top was 93 years ago and that the number 93 aligns/VIBRATES off 386 as well… and therefore, by definition also vibrates off mid-January.
If you think Gann’s Law of Vibration is happenstance, you might be stunned to know that the high in 1929 (386) is square October 19, the crash in 1987.

386, red
Oct 18, blue
In other words, the PRICE high in 1929 squares the DAY of the crash in 1987.
As we know, both the pattern and the time count of both those great crashes were remarkably similar.
Let’s turn to the apple of the bull’s eye… AAPL.

AAPL struck a low at 138 on October 4.
The Square of 9 below shows that one full rev of 360 degrees up from 138 is 188/189.
That gives us a possible price square-out for at least a reaction.

138/188 red
January 4, blue
However, notice that 138 and 188 are straight across and opposite today, January 4 for a possible TIME & PRICE SQUARE-OUT as well.
As well, today is 90 days/degrees or square the October 4 low.
AAPL came out of a mini Stein & Handle pattern on Monday. Breakage back below the “handle” in coming days opens the door to lower prices.
Is it possible, that AAPL that is sporty a hefty PE and price to sales ratio currently will telegraph a top in the market… technically?
Tomorrow’s report will further flesh out how several cycles (including war cycles) that are due to exert their downside pressure making 2022 one of the most eventful years in market history — suffice to say that 2021 was the 5th lowest volatility on record; 2022 will see an intense volatility.
99.999% of traders have never even seen the Square of 9... let alone understand its potential.
Do you dare to be different?

Popular posts
99.999% of traders have never even seen the Square of 9... let alone understand its potential.
Do you dare to be different?