Many market watchers often use the word “critical” when pointing at a potential market juncture.
But this week really is.
Here’s why.
A weekly SPX from January 2020 notes the three occasions since the February 2020 pre-crash peak where the 3 Week Chart turned down.
My 3 Week Chart Method does a superb job of determining the intermediate trend.
It turns down with 3 consecutive lower weekly lows — not closes, but 3 lower weekly lows.
Notice that the 3 Week Chart turned down on the week of the low in March 2020.
It next turned down on the week of 9/14/20.
That turn down defined a low the next week as the SPX reversed up, following a test of the rising 20 week ma.
This was the first test of the rising 20 week ma since the March 23, 2020 bottom.
The 3 Week Chart next turned down on the week of March 1, 2021.
That also defined a low — also in tandem with a test of the 20 wk moving average.
Last week, the SPX carved out 2 consecutive lower weekly lows.
Closing on the lows of the week set up another turn down of its 3 Week Chart.
I am writing this Sunday night and obviously, given the futes, the 3 Week Chart will turn down decisively.
The rising 20 week moving average is at 4341.
Remember that 180 degrees down from the 4545 ATH is 4410.
That level looks to be violated with authority this morning, opening the door to a 360 degree drop which ties to 4278.
So there is an important price band of potential support between 4341 and 4410.
Last week I compared the price action to the seasonal quadruple options expiration of June 18, 2021.
The SPX dropped 57 points that Friday, closing below the 50 day moving average. Sunday night the futures were down over 40 points, but by the open they had reversed green with Monday closing above the prior Friday’s high.
This is one of the factors leading me to recommend SPY 447, 446 and 445 strike SPY puts near Thursday’s close on the Hit & Run private Twitter feed.
The June post OPEX reversal occurred from an undercut of the widely-watched 50 day line.
Likewise, on Friday the SPX closed below its 50 day line.
The futures are down sharply overnight. So far they have yet to show a sign of reversing.
The difference this time around may be that the SPX snapped a 4 point trendline from the May low on the important Friday weekly closing basis.
The implication is a Flush of the 50 (day moving average) to the aforesaid 20 week moving average at 4321 to 4278.
Because the 200 day moving average hasn’t been kissed since June of 2020, we cannot rule out a plunge to the 200 day ma, which ties to the 50 week moving average at the 4100 region.
A key 540 degrees down from the SPX ATH is 4149.
Consequently, because of the breakage below what has heretofore been staunch trendline support at the 50 day ma, downside continuation following today’s turn down of the 3 Week Chart targets the 20 week at 4321 which, if broken, opens the door to as low as 4100.
I would not underestimate the market’s ability to drop quickly to satisfy the above levels.
Another reason this week is critical is that we are a key 540 days/degrees from the March 23, 2020 crash low.
One good crescendo deserves another.
Another reason a spike in volatility was on our clock was September 1987.
On September 22, 1987, the DJIA had the largest one day point gain in history to that point in time.
Of course, this was just weeks before one of the largest one day waterfalls in history —Black Monday, October 19, 1987.
What that has to do with today is that September 1987 is a Fibonacci 34 years ago.
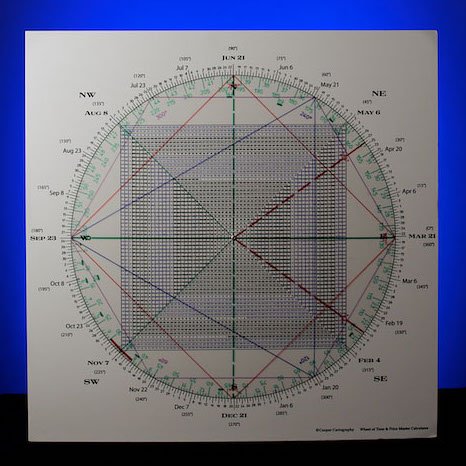
Checking my Square of 9 Wheel of Time & Price shows that 34 is square September 22.
Conclusion. In markets there is something called the Rule of Alternation. In other words, the pattern/structure that immediately preceded may not repeat. To wit, we may not get the pre-opening reversal into the green a la June 21, 2021.
It may take a whoosh that hits the aforesaid downside projections to POSSIBLY perpetuate a rally attempt at some point over coming hours/days.
In sum, the Square of 9 did a great job nailing the 4545 SPX ATH on September 2.
As the Square of 9 below depicts, moving the decimal point to get 454 shows it squares out/aligns with early September.
This square-out is exerting its downside influence with series of down days. Monday would be the 10th down day in 11 sessions.
Whether or not this means the Hunt For Red October is on the radar, as offered in this space throughout the summer, cycles project a change in character in the markets.