The Speculative Pathological Path
- July 6, 2021
- / By Jeff Cooper
“Cause there ain't no cure for the summertime blues.” – Blue Cheer, Summertime Blues
“Never be afraid of the normal movements: be fearful of the abnormal.” – Jesse Livermore
Market analysis usually involves a slow stream of revelations as a market is nearing a turning point.
Markets reveal additional clues pertaining to time and price as they unfold.
Cycles are overlapping and dynamic. That means there are multiple cycles working concurrently that overlap.
As well, some cycles will cease to exert their influence and reappear later.
The monthly SPX below is a perfect example.

In July 2016, the SPX broke out above an 18 month trading range from a high set in February 2015.
In researching every major swing in the SPX from 1941 for a seminar I gave in 2005 (available on DVD, Unlocking the Profits of the New Swing Chart Method), I found that 18 months was an important time frame.
From the July 2016 impulse to the big January 2018 top is 18 months.
From the September 2018 peak to the March 2020 low is 18 months.
From the January 2020 primary high (February was a nominal false high on the dailies) to July 2021 is 18 months.
It is worth noting that the important October 1998 pullback low was the slingshot for the 18 month blow-off into the March 2000 Bubble Top.
Decisive monthly cycles are converging once again.
Moreover, we are 60 months or 5 years from the July 2016 impulse.
5 years is an important market rhythm.
From August 1982 low to the August 1987 top was 5 years.
From the 1st quarter impulse in early 1995 to the bull market top in Q1 2000 was 5 years.
From the July 1932 low to the 1937 high was 5 years.
Speaking of… this week is the anniversary of the July 1932 Depression low — in terms of price (the bear market continued time-wise into 1942).
This week is the Fibonacci 89th anniversary of the July 1932 low.
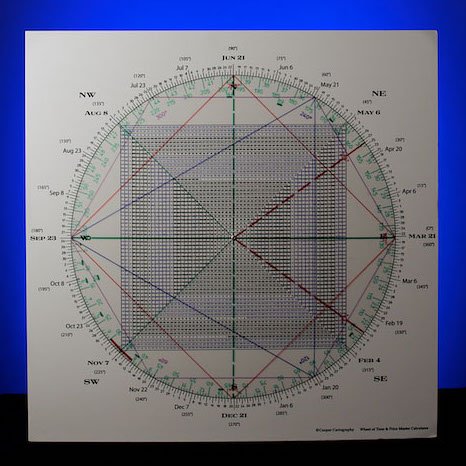
In addition, checking the Square of 9 Wheel shows that 89 aligns with late August…which ties to the culminations of the blow-off in 1929 prior to the collapse into 1932.

89, blue
Late August, red
As well, of course, late August ties to the culmination of the runaway move in 1987.
The two greatest crashes occurred following August peaks. The fact that 89 “points to”/ vibrates off late August may be synergistic.
For example, it is 58 years between the 1929 and the 1987 October crashes.
On the Square of 9 Wheel, 58 is square October 29, the date of the Big Crash in ’29.

58, purple
Oct 29, red
If you were like Paul Tudor Jones and saw the 1929 analogue to 1987 unfolding before the fact in 1987 and you had a Square of 9 Wheel, seeing this harmonic would have increased your confidence that a waterfall decline was on the clock.
I would not be surprised if PTJ in fact owns a Square of 9 Wheel.
This is but one example of the time/price harmonics that exist between the historic synchronicities of 1929 and 1987.
The market has been going up up up since the Lehman Brothers crash low on November 21, 2008.
Yes, the SPX struck a new low in March 2009, but that lasted 9 days and was an undercut low.
The NAZ struck its low in November 2008.
That was when key stocks like AMZN made their bear market lows.
Interestingly, the aforesaid 89 is square November 21.

89, blue
Nov 21, green
So the key late August time frame (which was also the secondary final high in 2000) is square late November.
If we get past this week, the implication is the market will extend into September, 18 months from the March 2020 low.
September is one year from the September 2, 2020 peak.
This September is also 20 years from September 11, 2001.
My gut tells me there is a strong likelihood that this September will be a trough rather than a peak.
On the day of the March 23, 2020 low, I projected a quick move to the 4000 SPX region.
We’ve gone well beyond that. The SPX has virtually satisfied a 100% advance in 4 squared months.
As well, Friday’s SPX ATH was 4355.43.
4356 is 66 squared.
This is an harmonic of the 666 SPX bear market low in March 2009.
I think these are important time/price harmonics.
We are 148 months from March 2009.
Remarkably, 148 is square mid-July. This was the primary high in 2007.

148, blue
Mid-July purple
The question that stares us in the face is whether the Fed liquidity hose money managers have been forced to drink from trumps natural cycles and the innate natural progression of market structure.
Market participants have learned to shrug off any exogenous events over the last 12 years — even a pandemic… courtesy of the Fed.
Facts are a red cape in the path of a charging bull. As is the case in all irrational vertical moves.
Liquidity is as liquidity does.
The market shouts money much as baseball fans should at the umpire until they are distracted by the next play.
There is no time in a baseball game. Be that as it may, there are innings.
Three outs and the inning is over.
We have seen two big peaks in the last three years that led to waterfall declines: September 2018 and January/February 2020.
I can’t help but wonder if an ultimate third peak will be followed by another waterfall decline with key support 1000 SPX points down from current levels at 3400ish, as depicted by the Ghost Line on the above SPX monthly.
Conclusion.
It’s all served (severed?) up with serious attitude from the best and the brightest who parade across the financial MSM chanting Buy the Dip… who spare no words to tell us what the truth of the tape is with such certainty, but almost always fail to tell us that the cards are marked and that if you should pull an inside straight, invariably a fire alarm will vacate the casino before you can collect.
We have all spent great sums collecting experience in the markets and do not begrudge the learning curve. That is part of acquiring the skill set to play.
We each build our judgment in different ways, but for some reason people think they can enter this game without a mentor — whereas they would never seek to rise to the level of a professional athlete without a coach.
For some reason folks think they can stroll into the world championship poker, the financial markets, because they did well in economics at Wharton or because they are a world class gamer or they can beat their buddies at Texas Hold ‘Em on Saturday night and that this will prevent the stuffing from being kicked out of them when the trend turns… because… well the market can’t go down — the Fed won’t let it. Right?
Seems to me the Margin Man did a pretty good impersonation of Freddy Krueger in 1929 and 1987… when the Fed was at the helm too.
There’s a reason for this. The barrier for entry to trading is but a click and a wallet away.
There’s a reason why success isn’t guaranteed for the smartest: the markets are more about bluffing than brains, more about diabolical than academic.
In sum, March 2020 marked the bottom of an A B C decline. This is one of the factors enabling me to project an advance to 4000.
The bigger question is whether March 2020 pulled back the rubber band for a 3rd wave of a final 5th.
Which begs the question — what kind of structure culminates in the 2021-2022 time period, 89-90 years from the 1932 low?
The legendary WD Gann put a lot of significance on anniversary dates. Let’s see what the behavior in July, August and September bring.
It should be an intense summer.
99.999% of traders have never even seen the Square of 9... let alone understand its potential.
Do you dare to be different?

Popular posts
99.999% of traders have never even seen the Square of 9... let alone understand its potential.
Do you dare to be different?