QQQ struck a new high on Monday as it satisfied 3 drives to the top of a trendline connecting February and April peaks.
This is important resistance. However, after going sideways for virtually 4 months since February, it would not be surprising for a Bull Trap false breakout to play out.
Notice a Ghost Line from the 165 low connecting the October 2020 low “calls” with the February peak where momentum crescendoed.
Breakage above the top's trendline suggests a push to 352 QQQ.
Allow me to explain.
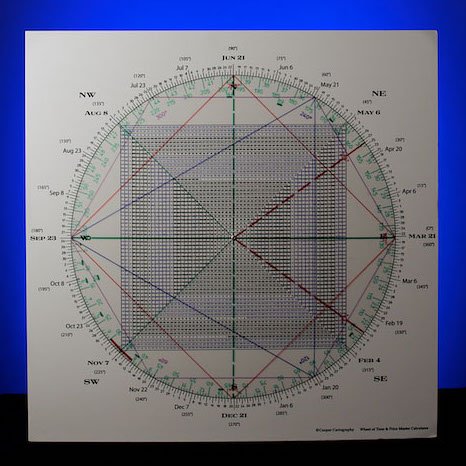
The March 23, 2000 crash low on the Q’s was 164.93.
A square of 9 shows that 165 is square March 23 for a Time & Price square-out.
In other words, 165 is 90 degrees square the day of the low, March 23.
This is + or – the variance for a square-out, especially as the market was in freefall.
Blue is 165
Red is 352 (3 full revolutions or 3 complete squares up… 1080 degrees)
Light green is 29 7 which was the March 2021 low.
Dark green is March 23, the March 2020 low.
You can see that on the one year cycle from March to March, the price low in March 2021 aligned with the 1 year cycle.
You can’t make this stuff up.
Last fall the Q’s carved out a double bottom at 260 and 267.
The square of 9 below shows how 265 (which is roughly the mid-point of the two lows) also vibrates off March 23, the “Zero Point” or impulse point of the advance, the March 2020 low.
As WD Gann wrote, “If you can find the zero point, you can measure anything.”
That’s what my Square of 9 Time & Price Calculator does.
Notice that 1 full rev of 360 degrees up from 265 is 334, with a 90 degree extension giving 352.
Red is 265 and 334
Blue is 352
Green is March 23
This is to say that if the SPX should break out above the aforesaid top's trendline at 343-344, my expectation is it runs to 352.
The idealized time frame for this to play out is into June 21, square the key March 21-23 time frame and opposite last year's big low at 165.
That said, when using the Square of 9 we must use the low and the closing low (as well as the high and the closing high) to measure.
The March 2020 closing low was 169.
The Square of 9 below shows that 343-344 is square the important 169 closing low from last year.
Green is 343
Red is 169
Blue is late April, the last swing high
So it is not a given that the Q’s will breakout .
Be that as it may, time is more important than price and what the markets are doing into June 21 will be key to observe.
Checking the above weekly QQQ again, we see well-defined support at 326 to 329.
A trendline connecting the September, October 2020 lows and the March 2021 lows comes in at 326.
Just above is the 20 week moving average around 329.
The 20 week ma has been tested/undercut 3 times since the advance off the March 2020 low started.
Each test has tied to a turn down in the important 3 Week Chart.
Consequently, this 3 point trendline in the 326 region becomes more critical.
Breakage below 326 should perpetuate a drop to the 50 week moving average, currently at the 305 region.
That would represent a normal 10% drop,
On Monday, Paul Tudor Jones offered that today is the most important Fed meeting in Jay Powell’s tenure.
Maybe something, maybe nothing, but the seed for the Fed was planted in 1910 at Jekyll Island — 111 years ago.
In the midst of the word soup from Powell today, is Mr. Inflation going to shout, “The Fed is transitory?”
On the Square of 9, the number 111 vibrates/aligns with 343/344… yesterday’s ATH in the Q’s, the tip of the spear of risk-on.
Purple is 111
Blue is 343/344
In sum, the behavior of the market over the next week will be important.
Not all breakouts are created equal.
Time & Price suggest a breakout will be a Bull Trap prior to at least a 10% decline.