On Thursday, TSLA gapped down to 666, within 1% of the idealized projection, and reversed with authority, carving out a Large Range Outside Up Day or LROD (Lightning Rod).
Notably, TSLA didn’t wait to kiss the trendline at 660.
There are two factors underpinning this:
1) TSLA turned its 3 Day Chart down on the open. A turn down in the 3 Day Chart often defines a low if a rally phase is on the table. At the very least, a turn down in the 3 Day Chart typically sees a knee-jerk rally.
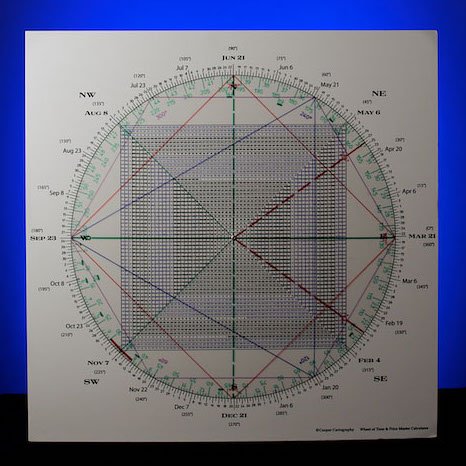
2) 667 is square March 5 — the date of TSLA’s low for the year. TSLA struck 666.14 Friday morning — close enough for government work.
Blue is March 5
Red is 667
Large range engulfing bars such as TSLA’s on Friday act like magnets attracting traders' attention and typically see follow through — at least in the short-run.
Range precedes price.
As well, TSLA left an Expansion Pivot buy setup on Friday. This is the largest range in 10 days that reclaims the 50 day moving average (or loses it for sells).
So there is a Combo buy setup suggesting an extension higher — an LROD and an Expansion Pivot.
However, as offered in last week's article, TSLA’s all time 900 high aligns with/vibrates off May 8. This setup looms large, threatening a potential failed rally attempt.
It is important to keep in mind that as W.D. Gann wrote, it is always the “week of” a square-out to observe — not necessarily the exact day of the square-out.
Because TSLA rallied off the 660 region, the presumption is that with this week’s potential time/price setup off the all-time 900 high, the likelihood is that with a rally we will be staring another high, a lower high, in the face.
Assuming a corrective rally is on the table (versus an impulsive new leg up) how do we make a projection?
Allow me to explain.
90 degrees up from Friday’s 666 low is 692.
TSLA cleared 692 decisively on Friday, opening the door to the next decrement of 90 degrees up which is 720.
TSLA struck a high of 715.47 on Friday as it hit its overhead 20 day moving average.
If TSLA eclipses 720 it opens up the door to another 90 degree move up which ties to 640.
Interestingly, TSLA meets Phil D. Gap at 738. This is the open gap from April 27.
740 is straight across and opposite March 5, the low for the year.
In sum, there is beaucoup resistance at this 738/740 region should TSLA push higher.
Now that TSLA has carved out a 3 point trendline off the March 5 lows, breakage below this trendline (roughly 666 now) will trigger a Rule of 4 sell signal… a break of a 3 point trendline.
As well, a failure subsequent to this rally back below Friday’s low will also trigger a powerful Reversal of a Reversal sell signal.
In other words, a knife back below Friday’s large reversal is a conspicuously bearish sign that TSLA has engine trouble.
If this occurs, it opens the potential for a waterfall decline to the lows of the year in the 540 region.
TSLA’s 200 day moving average currently resides at 567.
It has not tested its 200 day moving average since March 2020, when TSLA traded at 70.
Remarkably, the following Square of 9 shows that 70 aligns with MARCH 5, this year’s low.
By definition then, 70 is square 667 — basically Friday’s low.
70 is red
March 5 is blue
There is a good reason why TSLA rallied sharply on Friday.
This was a good time/price inflection point.
However, by the same token, a failure back below Friday’s “square-out low” could see the wheels come off, literally, with the aforementioned 576 level and the 200 day moving average being precisely 360 degrees (one full price cycle) down from Friday’s 666 low.