But one of the biggest fallacies is that prior strength must be revisited.
Momentum is momentum only until a crescendo.
Once a Climax Run has occurred and the back of a runaway move has been broken, stocks often return to their point of origin.
Parabolic booms often give rise to monumental busts.
Few and far between are the Comeback Kids like AMZN and FB.
In the aftermath of Climax Runs, there are no buyers left.
Everyone that wanted to buy has bought.
Those dyed in the wool bulls who believe that prior strength must be revisited often end up losing more by buying all the way down. After all, if they liked a name at 100, they really like it at 80 and they love it at 60.
Indeed, many investors lost more money buying the RCA, the APPL of the 1920s, all the way down after the ’20 crash, then those investors who lost money in the crash itself.
Let’s take a look at FLGT, a stock that shows an implosion after a classic Climax Run.
FLGT exploded out of a cup in handle this year running from the pivot at 52 on January 4 to 190 on February 9.
Basically a SEVEN week buying stampede.
How would one have know that February 9 marked the top of a Buying Climax?
Well the low prior to FLGT coming out of its Cup & Handle was 42.50.
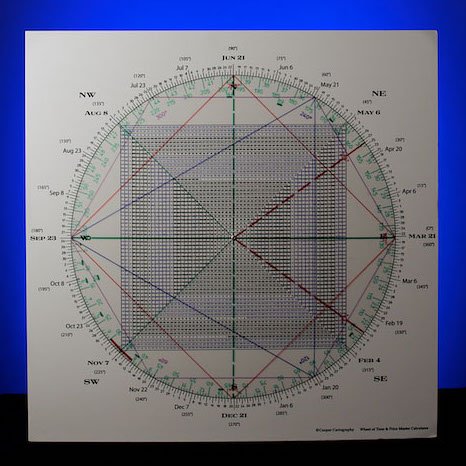
As the Square of 9 below depicts, 42.50 vibrates off/is square February 9.
Purple is 42.50
Red is February 9
Time points to price, price points to time.
This was a warning confirmed by the price action off the high.
The 3 Day Chart turned down right off the high, followed by decisive breakage of the rising 20 day moving average.
This was a bearish event because a test of the rising 20 day is what I refer to as a Holy Grail buy setup — especially the first such test in the midst of a strong uptrend.
FLGT failed the Holy Grail which perpetuated a test of its 50 day line.
It tried to reclaim its 50 day m.a. on March 17, but failed to follow through to the top side.
In so doing, FLGT opened the door to lower and Hit & Run members shorted it at 98.02 on Monday, anticipating further weakness.
Partial shorts were covered for a 3.31 gain. Yesterday we covered another tranche, locking in a 9.89 gain.
We are up over 12 points on the balance of the position.
In sum, markets can turn on a dime, most traders cannot. Parabolic moves are strength until they are not and, once broken, rather than offering buying opportunities, they offer better sell setups on the rallies as those that believe in “the story” are disabused of it as the stock rolls over yet again.
The real story is the story told by the Square of 9.
The 42.50 low synchronized with February 9, the day of the top.
Not all square-outs are this dramatic, but parabolic runs into such square-outs often are blaring sirens.