Is A Trap Door Looming In the Market?
- March 15, 2021
- / By Jeff Cooper
“Funny how my memory skips while looking over manuscripts” – Simon & Garfunkel, A Hazy Shade of Winter
Other than the September drop, the stock market has continued relatively unabated to the topside since the March 2020 low.
It has essentially fulfilled my projection made on March 23, 2020 for a quick move to 4000 SPX.
This was a relatively simple projection at the time… if one assumed one year ago that a major Selling Climax was on the table and the bull market would reset.
Here’s what was behind both conjectures.
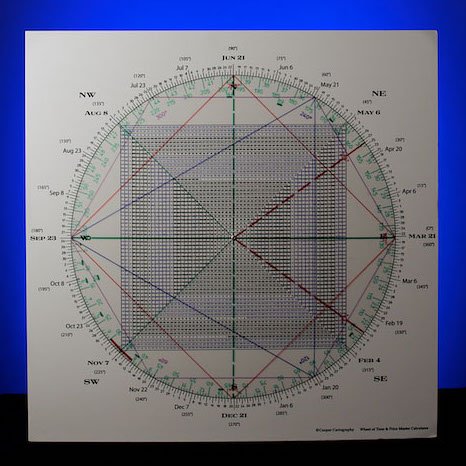
1) As shown several times since the low one year ago, March 23 squares out or balances out with the 3393 February peak prior to the crash.

Orange is 3393 (393 in the outer grid of 3,000s)
Green is March 23
Time points to price, price points to time.
If you look at things through a different lens, the things you look at change.
2) The structure of the market suggested to me that an A B C decline was satisfied with the crash last spring.
In other words, the crash into December 2018 was an A wave down followed by a B wave into January/February 2020 leaving the table set for a vicious C wave decline. Importantly, the structure of the advance into January/February 2020 was corrective (B wave) versus impulsive (bullish).
When you look at things differently, the things you look at change.
As in life, so in the markets. Looking at the markets through the lens of the Square of 9 Wheel allows you to peek behind the Time & Price Kimono.
My projection to the 4,000 SPX region was predicated upon the conceptually correct concept that markets seek equilibrium and that they are symmetrical and non-random.
Based on this, my thinking was that a new upleg was on the table and that if the SPX could reclaim a 50% retrace of the 1200 point drop (600 points or 2790ish), it opened the door to a 600 point rally added to the February 3393 peak.
3393 + 600 points gives 3993.
As it happens, the SPX struck 2790 on the 3rd week off the low in the aftermath of turning its 3 Week Chart up.
So far, the SPX struck a high of 3950 on February 16 and set a nominal new high last week.
As W.D. Gann wrote, time is more important than price and there are a number of reasons why mid-February marked an important potential turning point — not least of which it marks 60 months or 5 years from the major February 2016 low.
As with the advance into the February 2020 high, the structure of the advance from March 2020 shapes up as more of a zigzag than an impulsive 5 wave structure.
Remarkably, the pattern from the January/February high mirrors the pattern from this February’s peak to this week.
In other words, there was a primary high on January 22, 2020 and a secondary nominal new high on February 19, 2020.
Currently, we got a high on February 16, a correction, and we are staring another new high in the face.
Whether this is a secondary high as last year or the real deal, a genuine breakout, is yet to be determined, but as offered, the zigzag nature of the rally combined with the loss of the leadership that got us here in the first place — marquee tech such as AAPL, AMZN, TWLO, CRWD, OKTA, COUP and FVRR to mention a few — leaves the market suspect.
Rotation can keep the averages at large buoyant, but leadership is as leadership does.
My thesis is that, ultimately, the averages play Ketchup to leadership.
In addition to the Square of 9 Wheel, from my perch, the keys to forecasting the markets and identifying setups is multiple time frame and cyclical analysis. The trend doesn’t hinge on one single time-frame, it is a composite of wheels of time within wheels of time.
Again, time is more important than price.
Price is the final arbiter, but time is the prosecutor.
So let’s pull the lens back to see what the big picture monthlies look like on the SPX.
The following monthly is the SPX from the 2009 low.

It shows an Elliott Wave count of 5 waves up to the January 2018 peak.
Elliott Waves are not one of my primary ways for determining the trend.
I believe the overall premise of an impulsive 5 waves and corrective 3 waves is conceptually correct.
However, many proponents get wrapped up in the minutiae.
Be that as it may, the above monthly SPX has advanced with authority above the January 2018 peak.
In doing so, the implication is that the 5 waves up to January 2018 was not a “final 5” but a 5th of a 3rd wave.
There are 2 big picture interpretations:
1) The SPX carved out a 4th wave low following an A B C correction into March 2020. If this is true, then theoretically, the SPX is in only the 1st wave up of wave 5 to a final bull market top.
However, as offered above, the structure of the rally off the March 2020 low does not fit an impulsive structure ideally.
2) If it does not fit an impulsive structure ideally, then the prospect presents itself that a large A B C D E structure is playing out. The implication is that an E Wave opens the door to a drop to around the 2700 level — theoretically to 2000.
Even a bullish scenario consistent with a wave 1 up allows for a drop of the trendline connecting the March 2009 low and the March 2020 low.
Currently this ties to around 2675. Notice there are some key closing monthly lows around this region that could magnetize the SPX lower should it break support with authority.
A 50% retrace ties to around 3100.
If the first scenario is correct, then a large wave 2 correction is around the corner.
That some kind of top is on the table is underscored by the cluster of two trend lines at current levels.
These are a SEVEN year trend channel and a trendline from late 2018.
Either way, the largest draw down in a year looks like it’s on the table.
Breakage below this month's low will trigger a Get Out of Dodge sell signal.
Why?
Two technical considerations will be violated if this occurs.
1) March so far shows an outside up month, a failure below the March low in April will trigger a Reversal of a Reversal or what I call a Keyser Soze. I call it that because fast moves come from false moves and catch the vast majority wrong-footed, so to speak.
2) Sustained trade below the March low also violates a trendline connecting the January 2018 top and the February 2020 top.
In sum, while the SPX has scored new highs following an early March down-draft that Flushed the Fifty (the 50 day moving average), the index must show momentum now or be in jeopardy of putting in a secondary high to the February high.
This closely mirrors the pattern from early 2020 when the SPX put in a primary high in January and a secondary high in February prior to a crash.
Succinctly, breakage now below the 3940-3950 region that sees follow through opens a Trap Door.
Did the 144 Fibonacci month anniversary of the March ’09 low light the fuse for an explosive new up leg or will the 21st Fibonacci year anniversary of the March 2000 Dot.Com Bubble mark a top of some significance?
“Seasons change with the scenery, weaving time in a tapestry.” – Simon & Garfunkel